Create with Confidence,
Powered by AI Insights
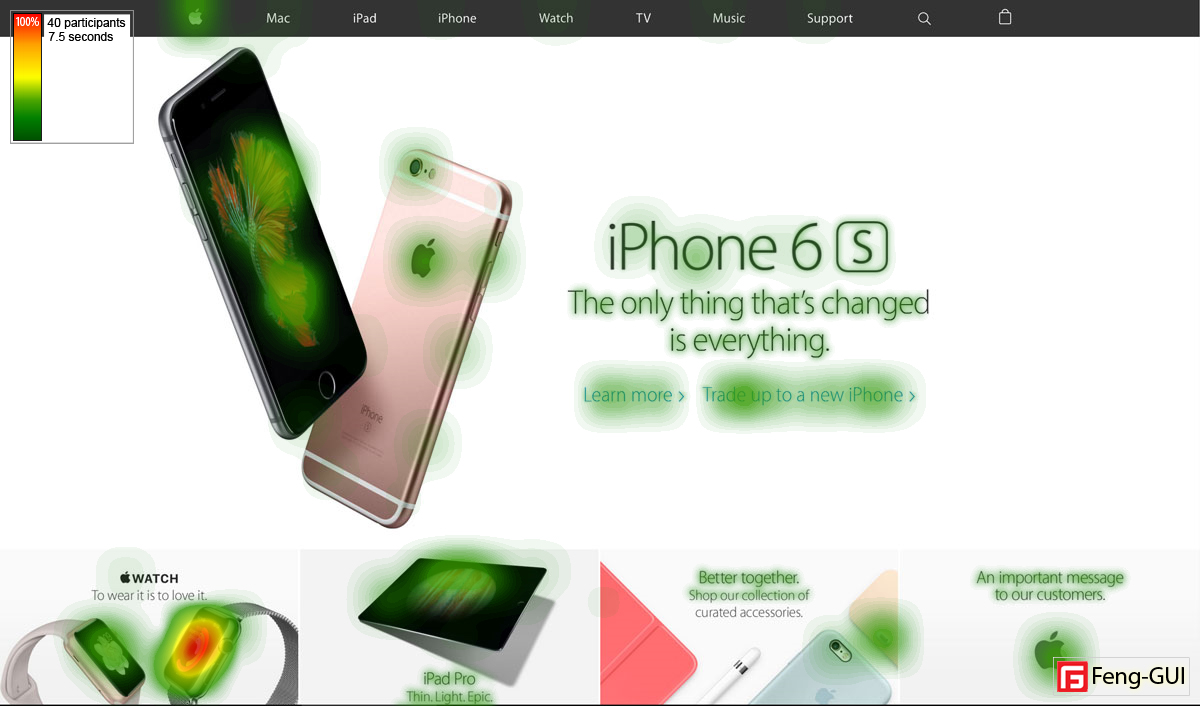
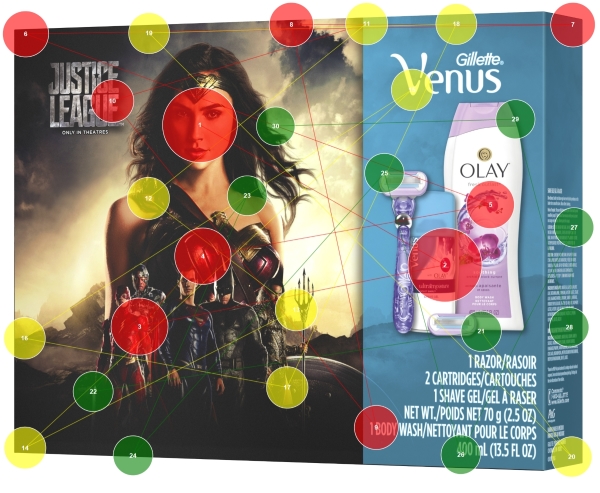
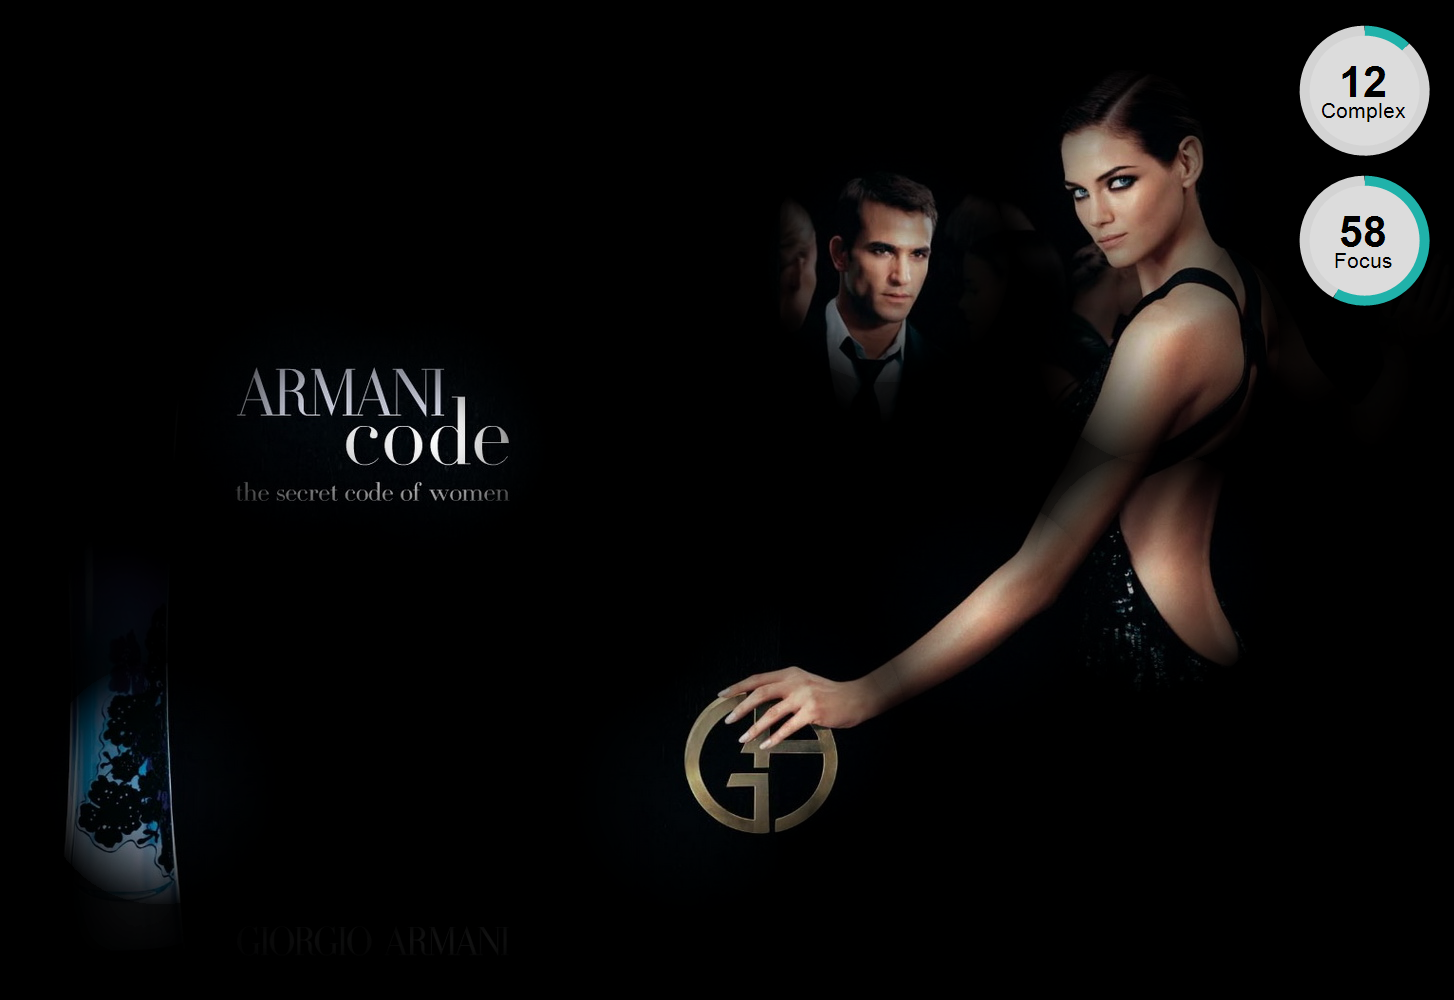
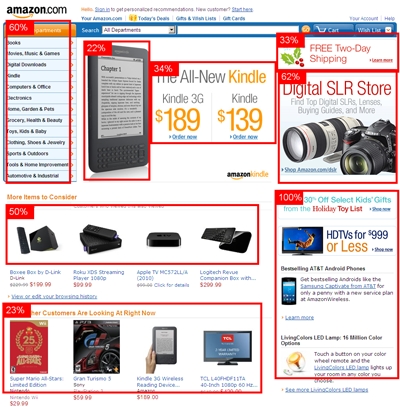
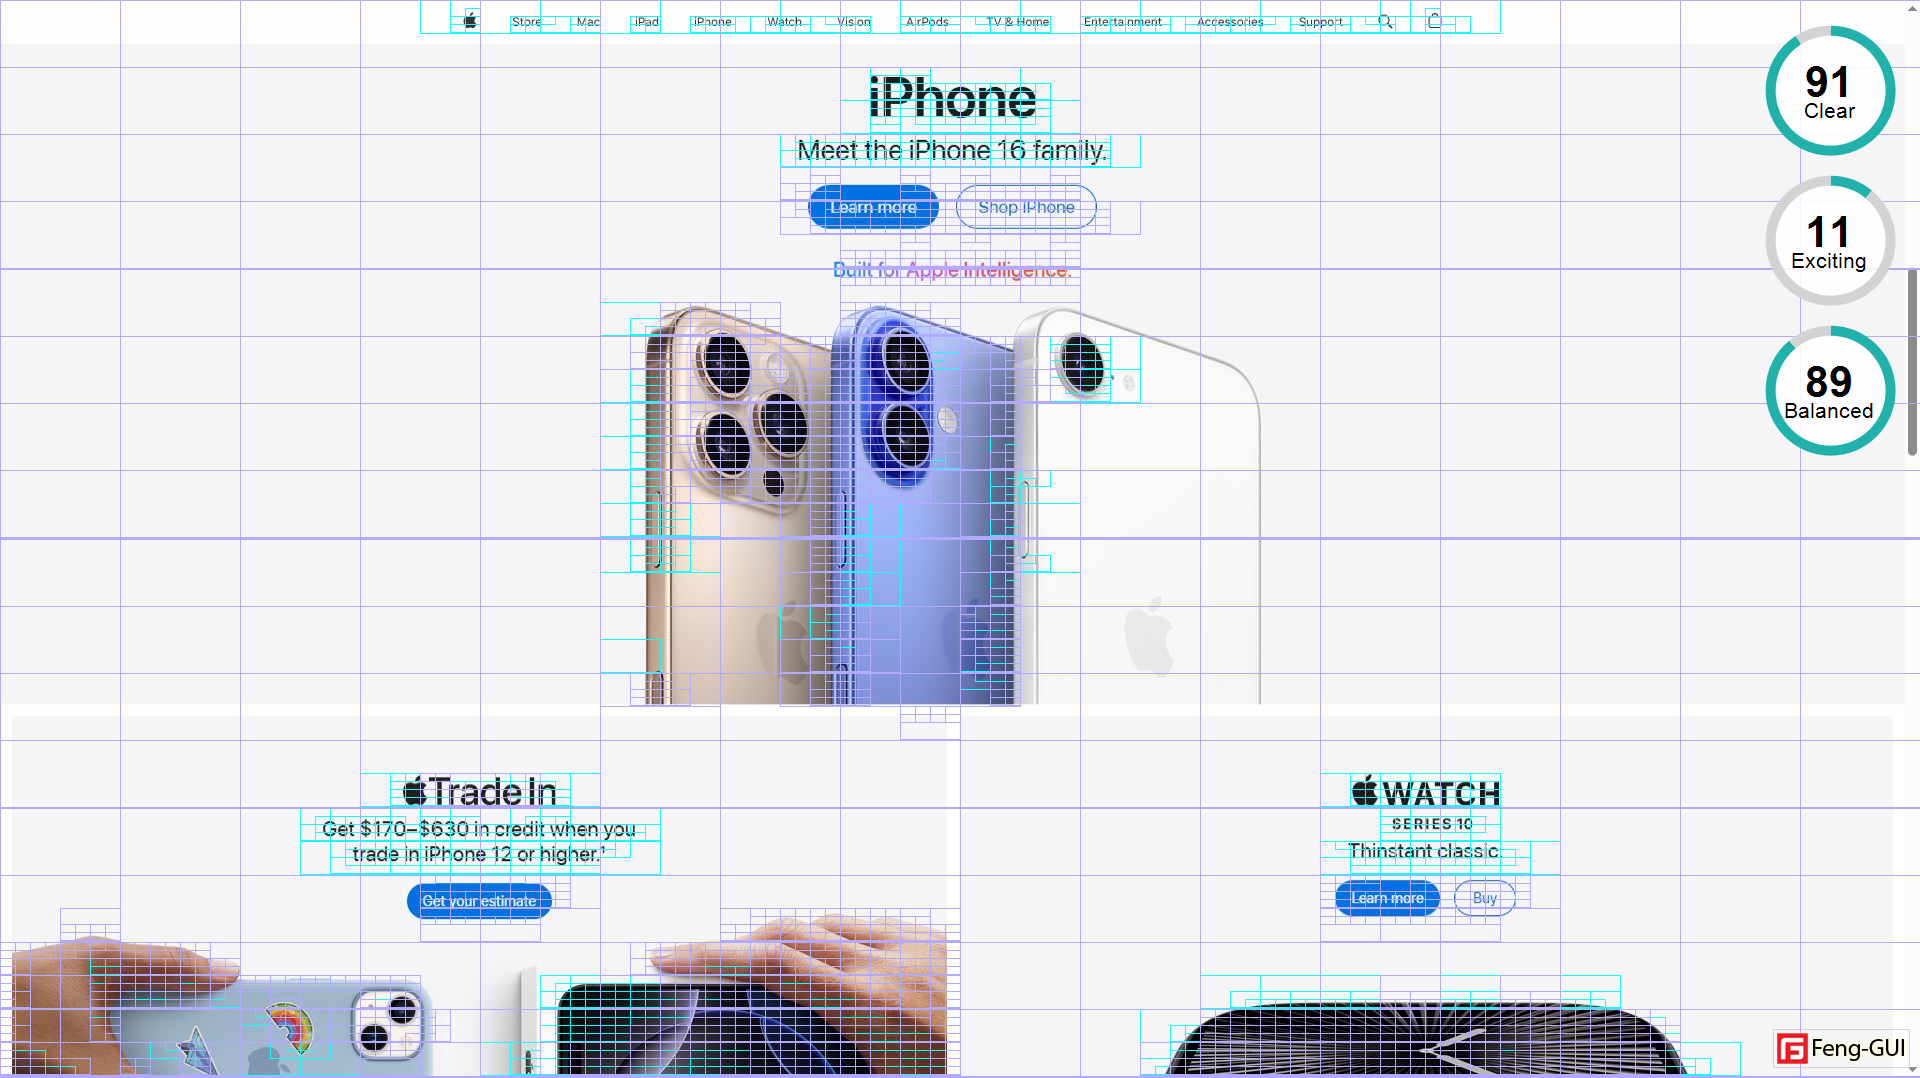
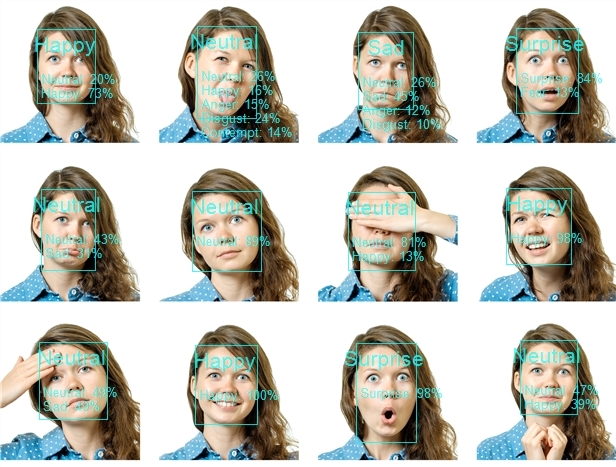
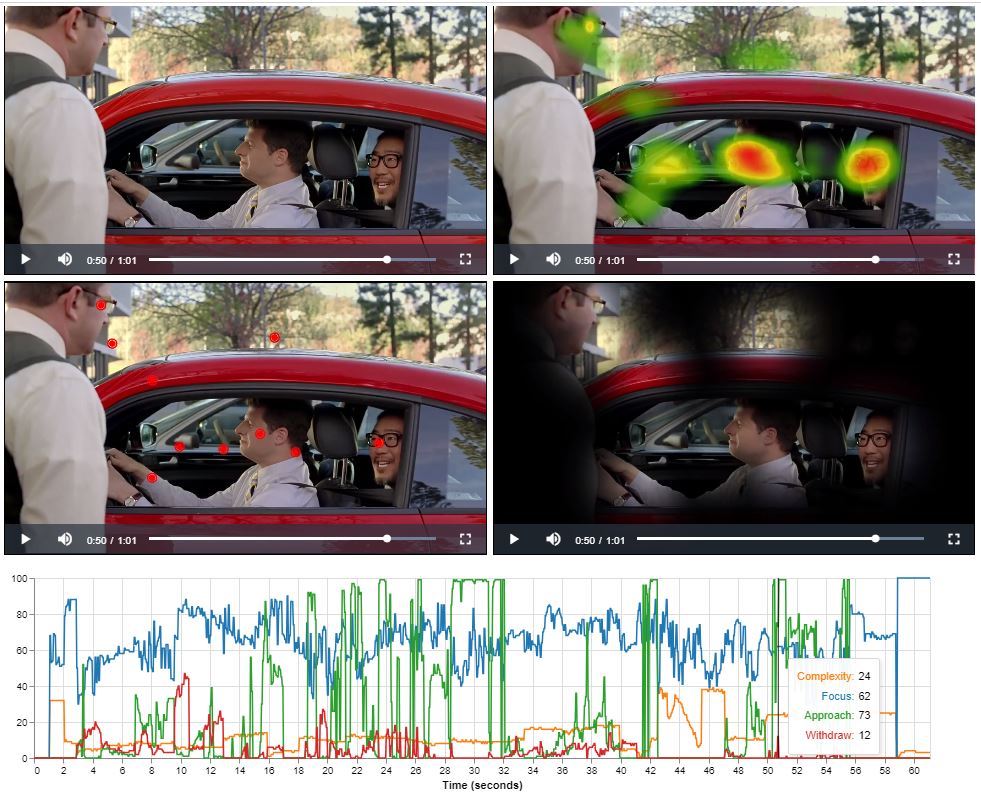
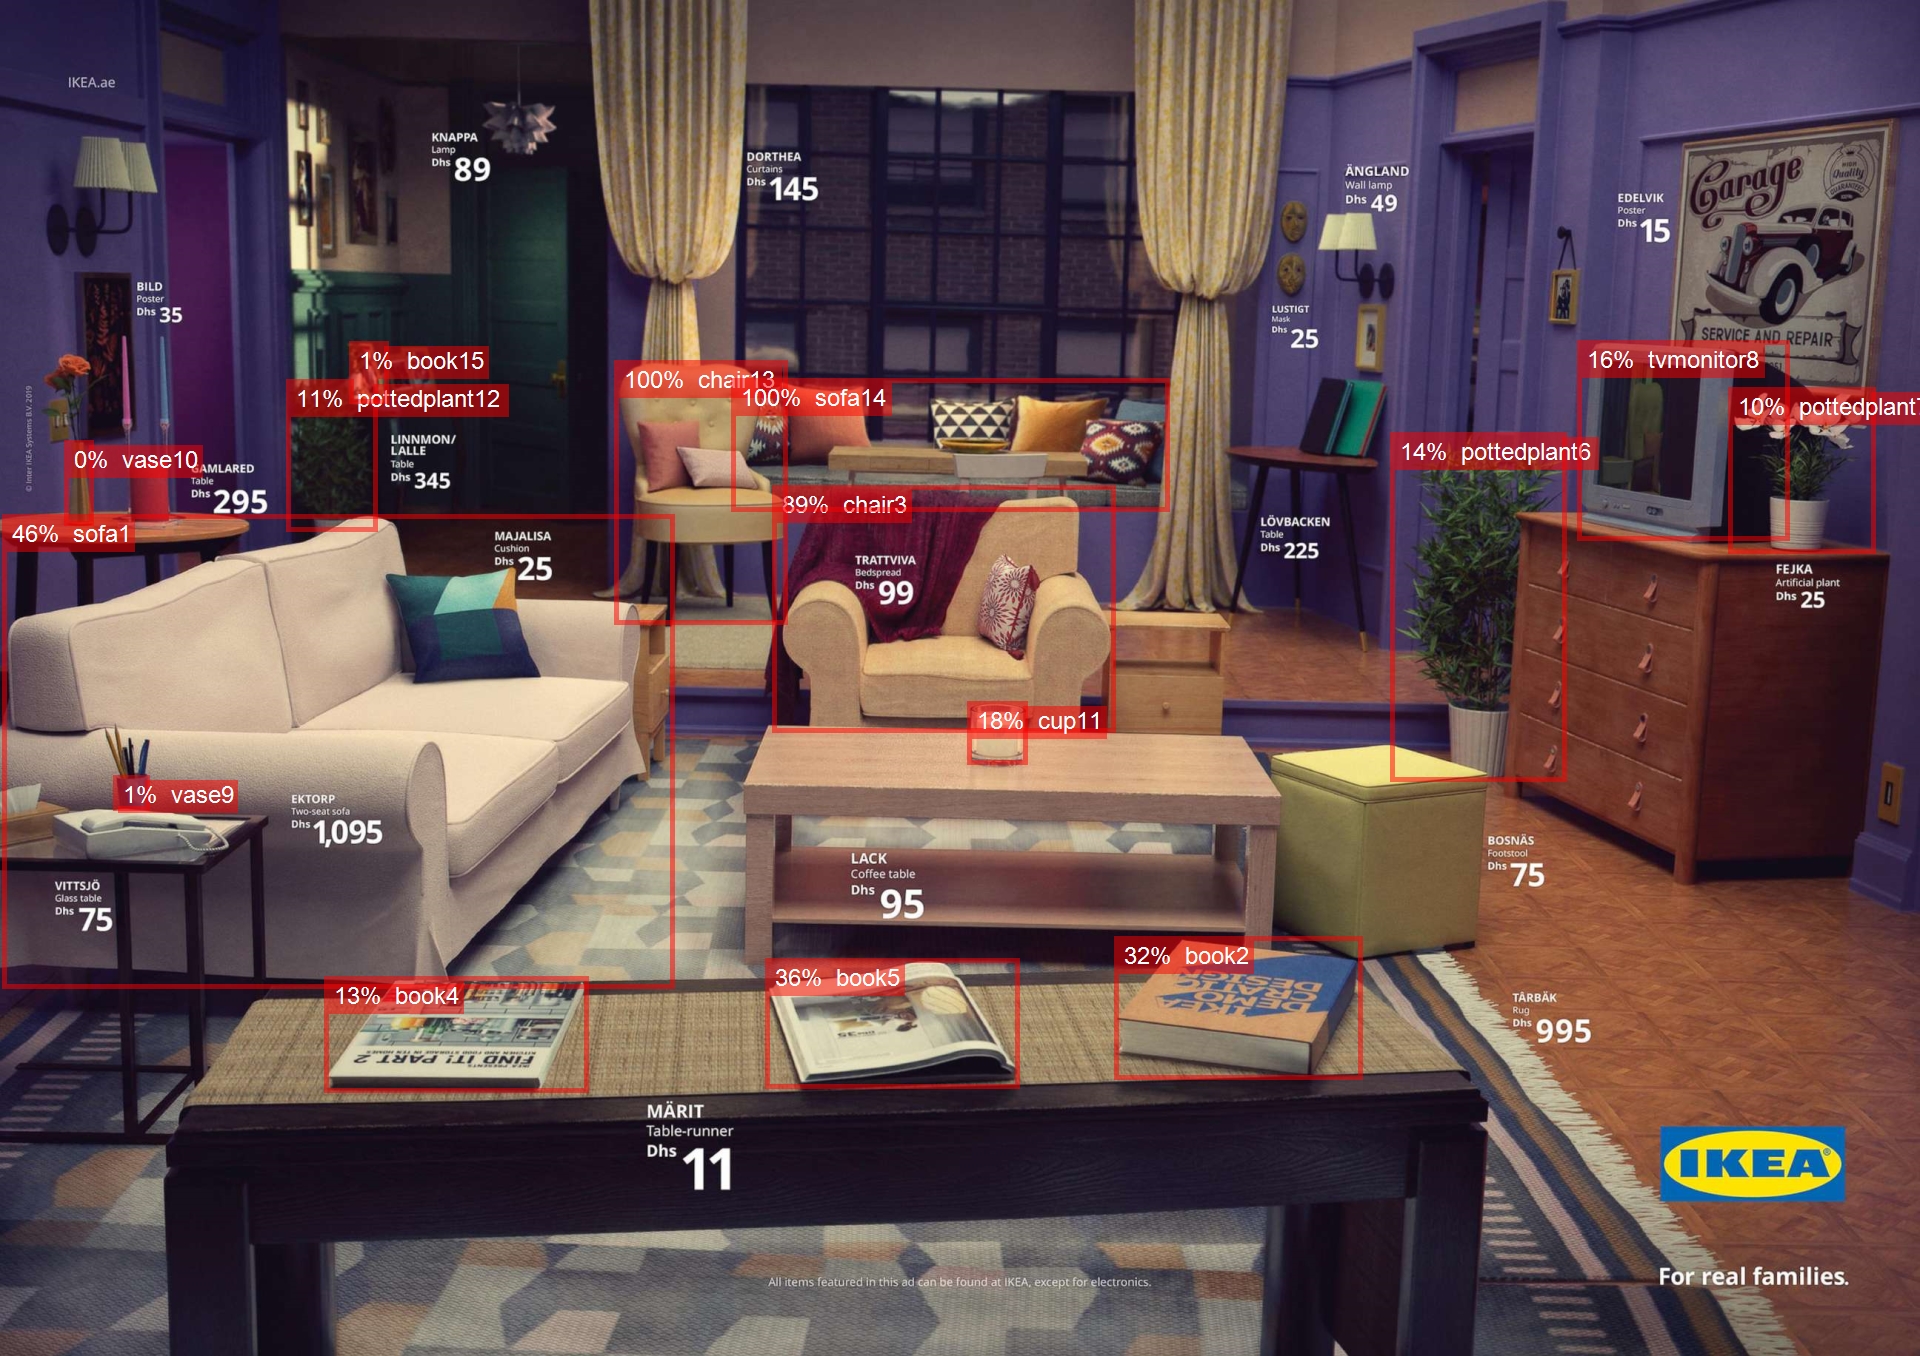
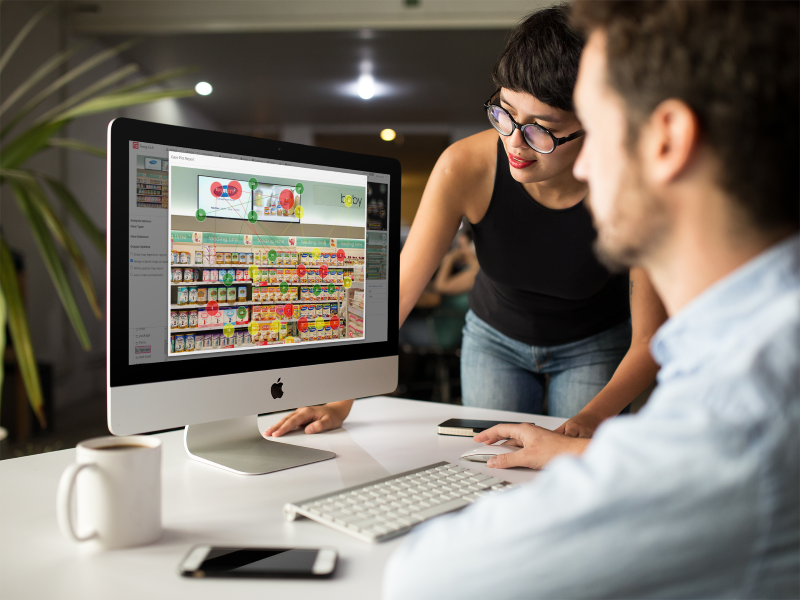
Feng-GUI empowers you to predict human attention and attraction with precision. Understand what will captivate viewers as they engage with your webpage, advertisement, video, signage, packaging, or any visual content.
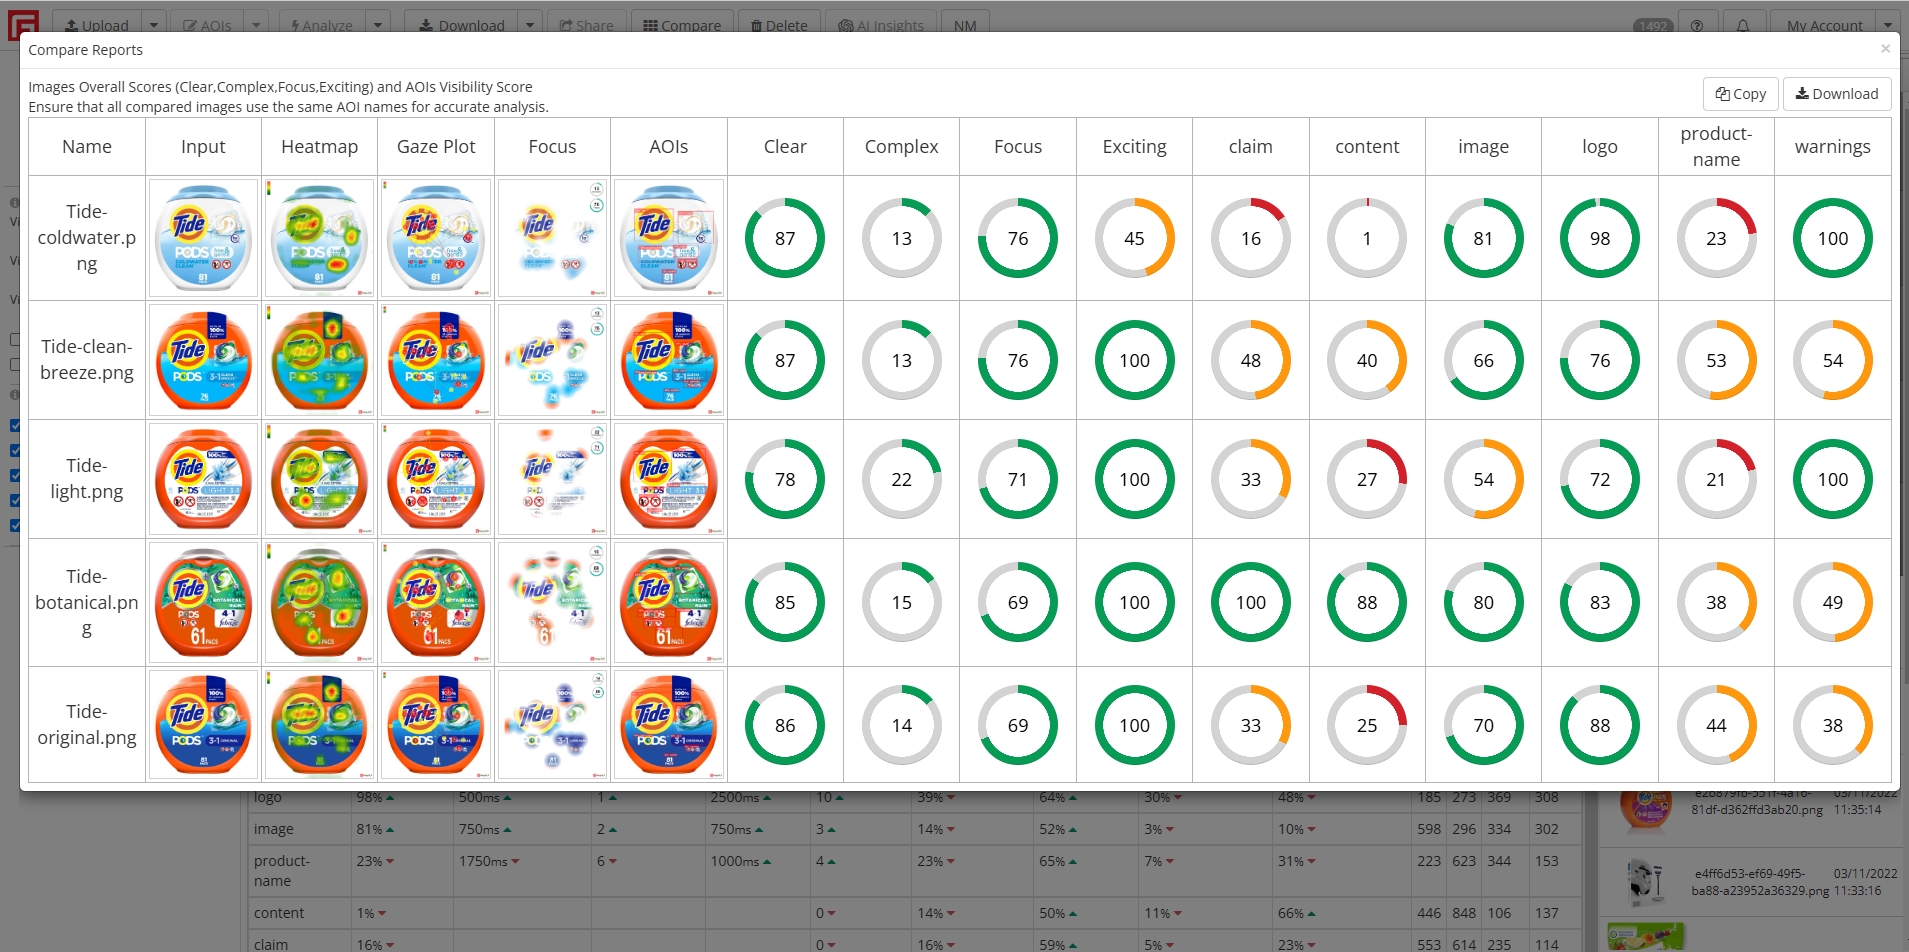
Used by digital marketing and research agencies, Feng-GUI optimizes visual performance by analyzing attention levels, visual effectiveness, and placement to ensure maximum impact.
Start My Free Trial

 Feng-GUI dashboard comes in three different flavors: