Create with Confidence
Powered by AI
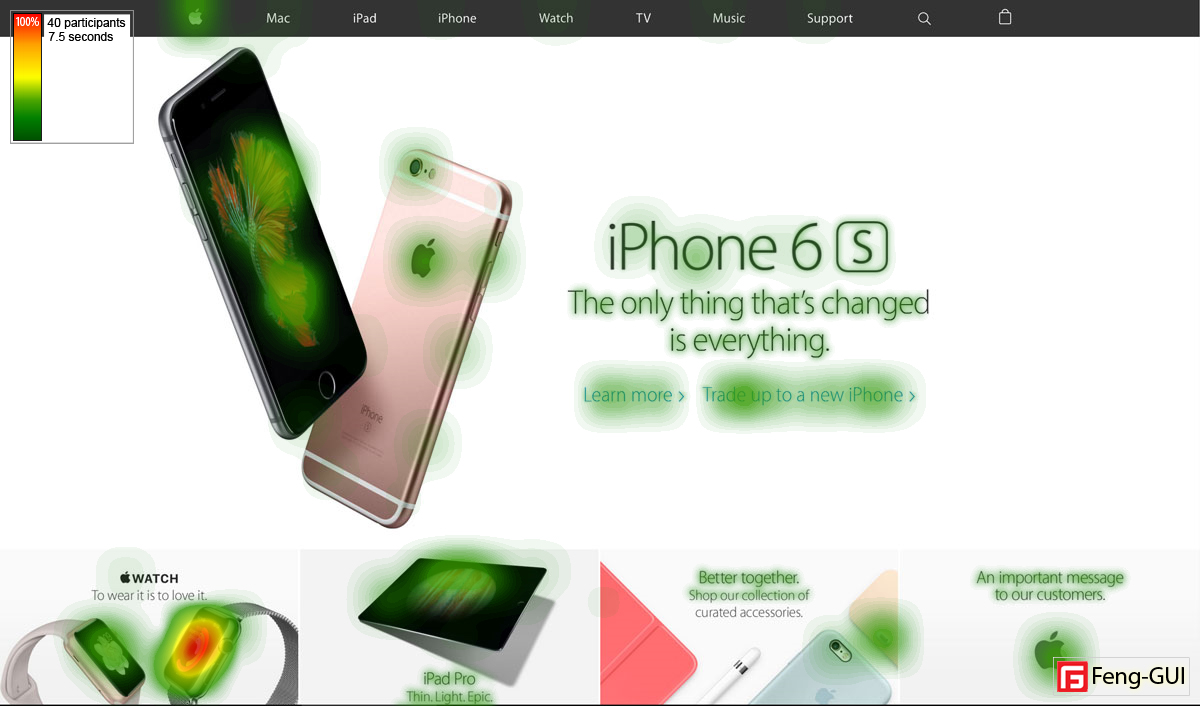
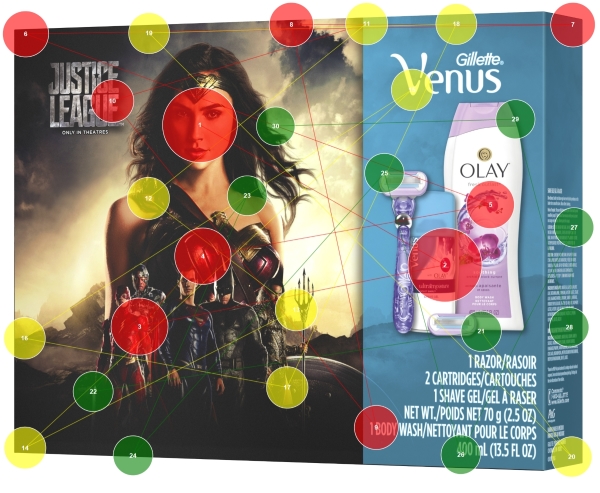
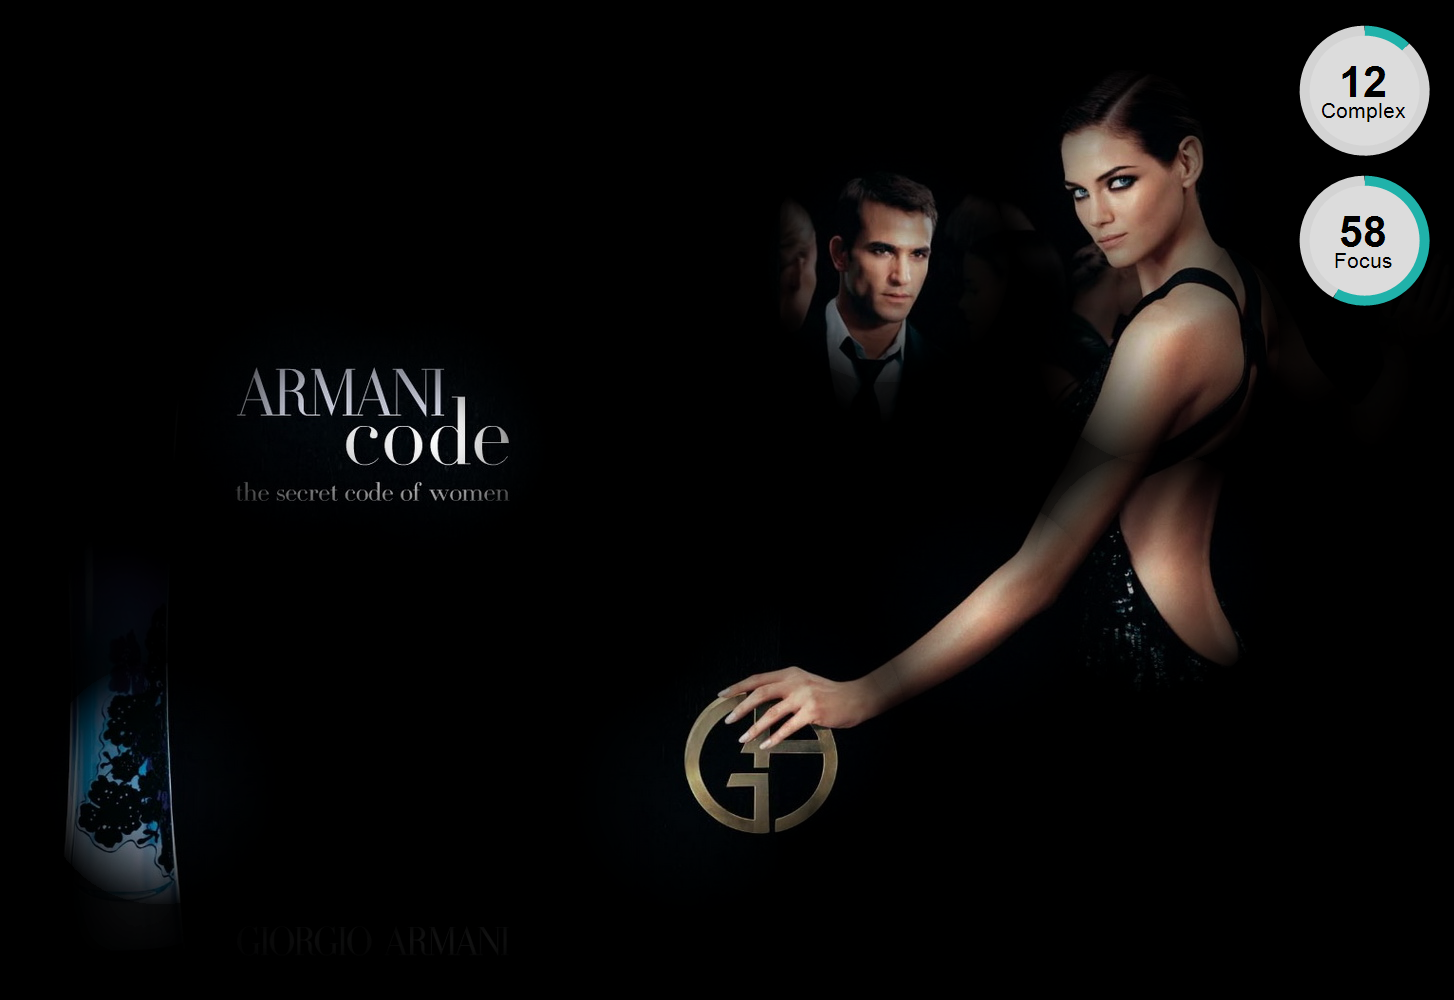
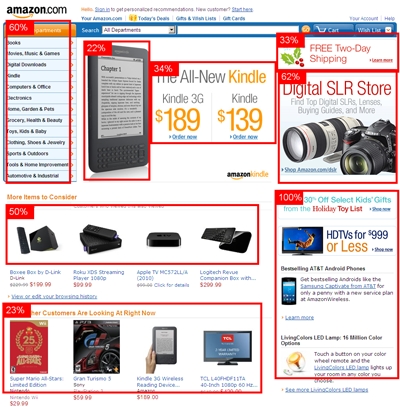
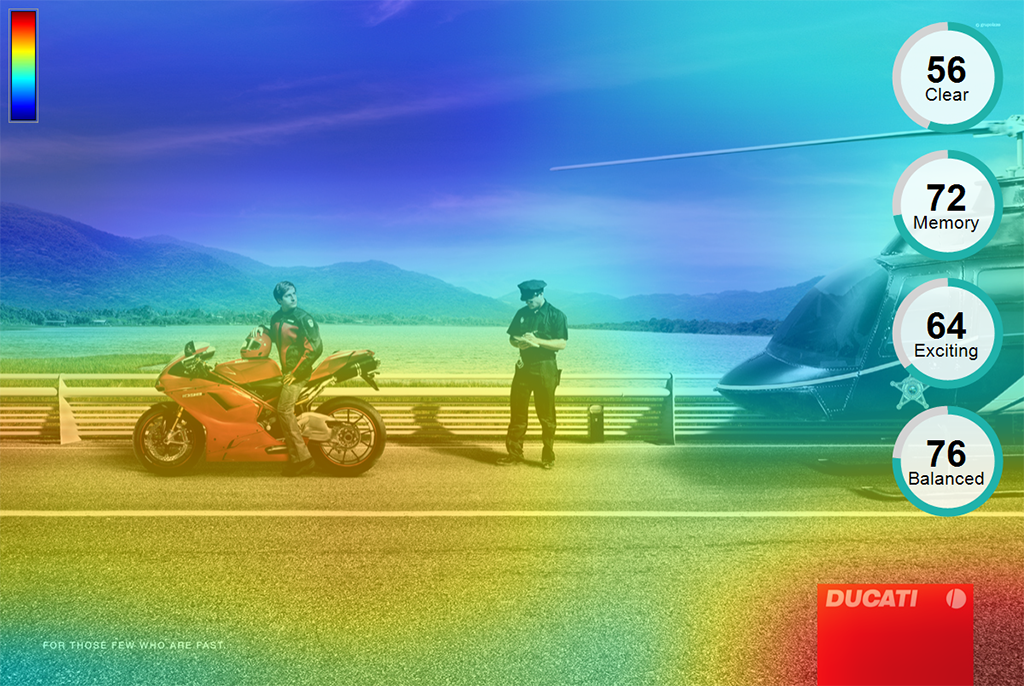
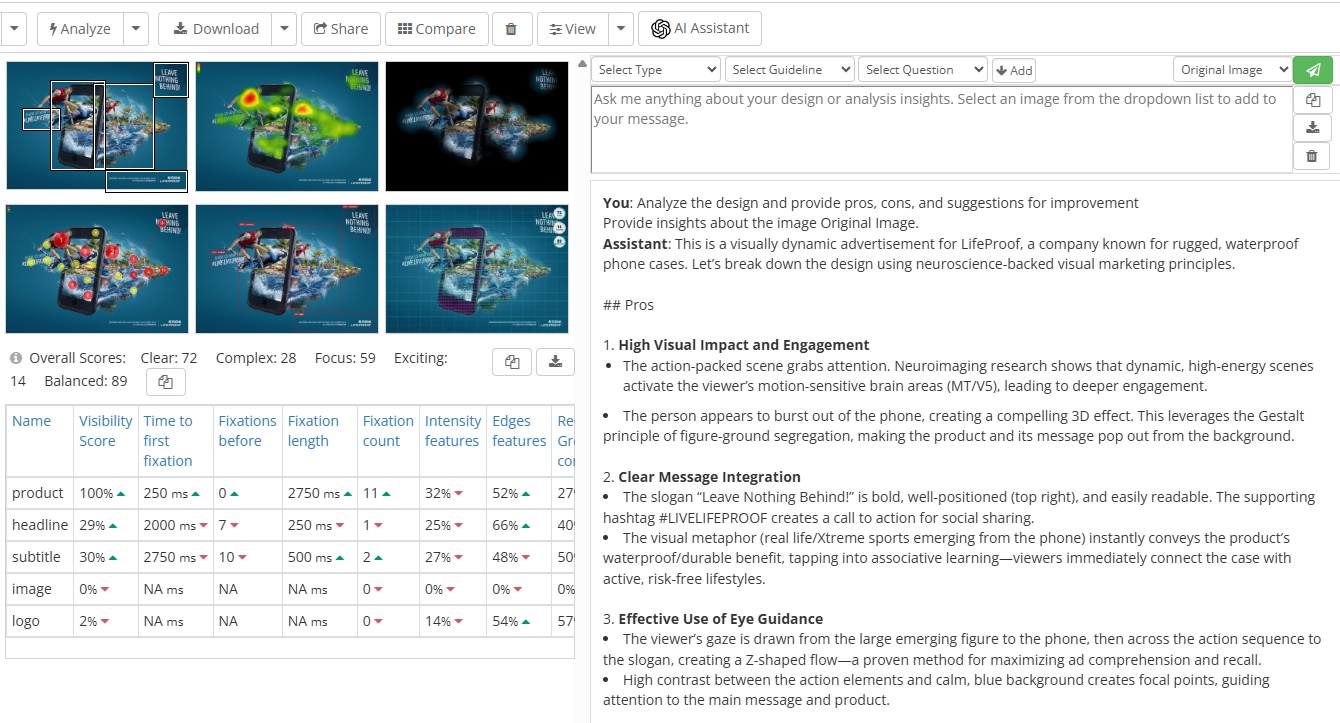
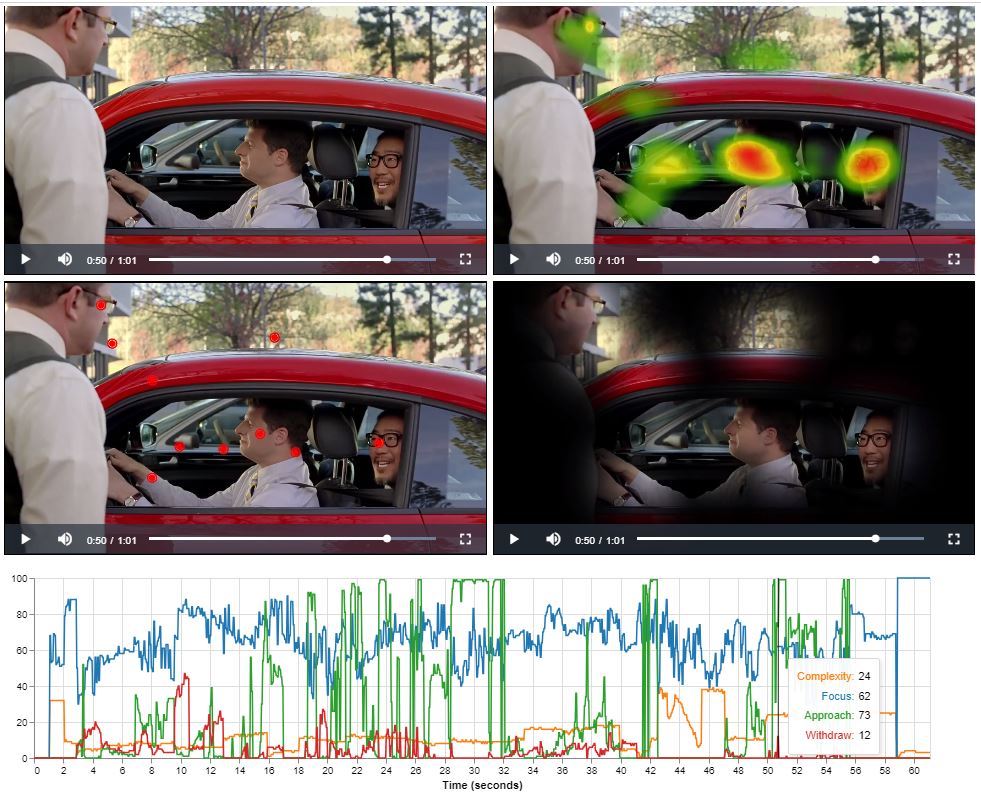
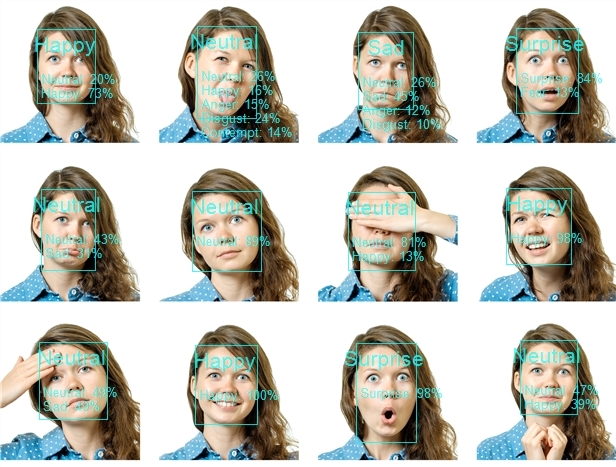
Feng-GUI enables you to predict and optimize human attention with remarkable precision, while also analyzing emotional responses and assessing content memorability.
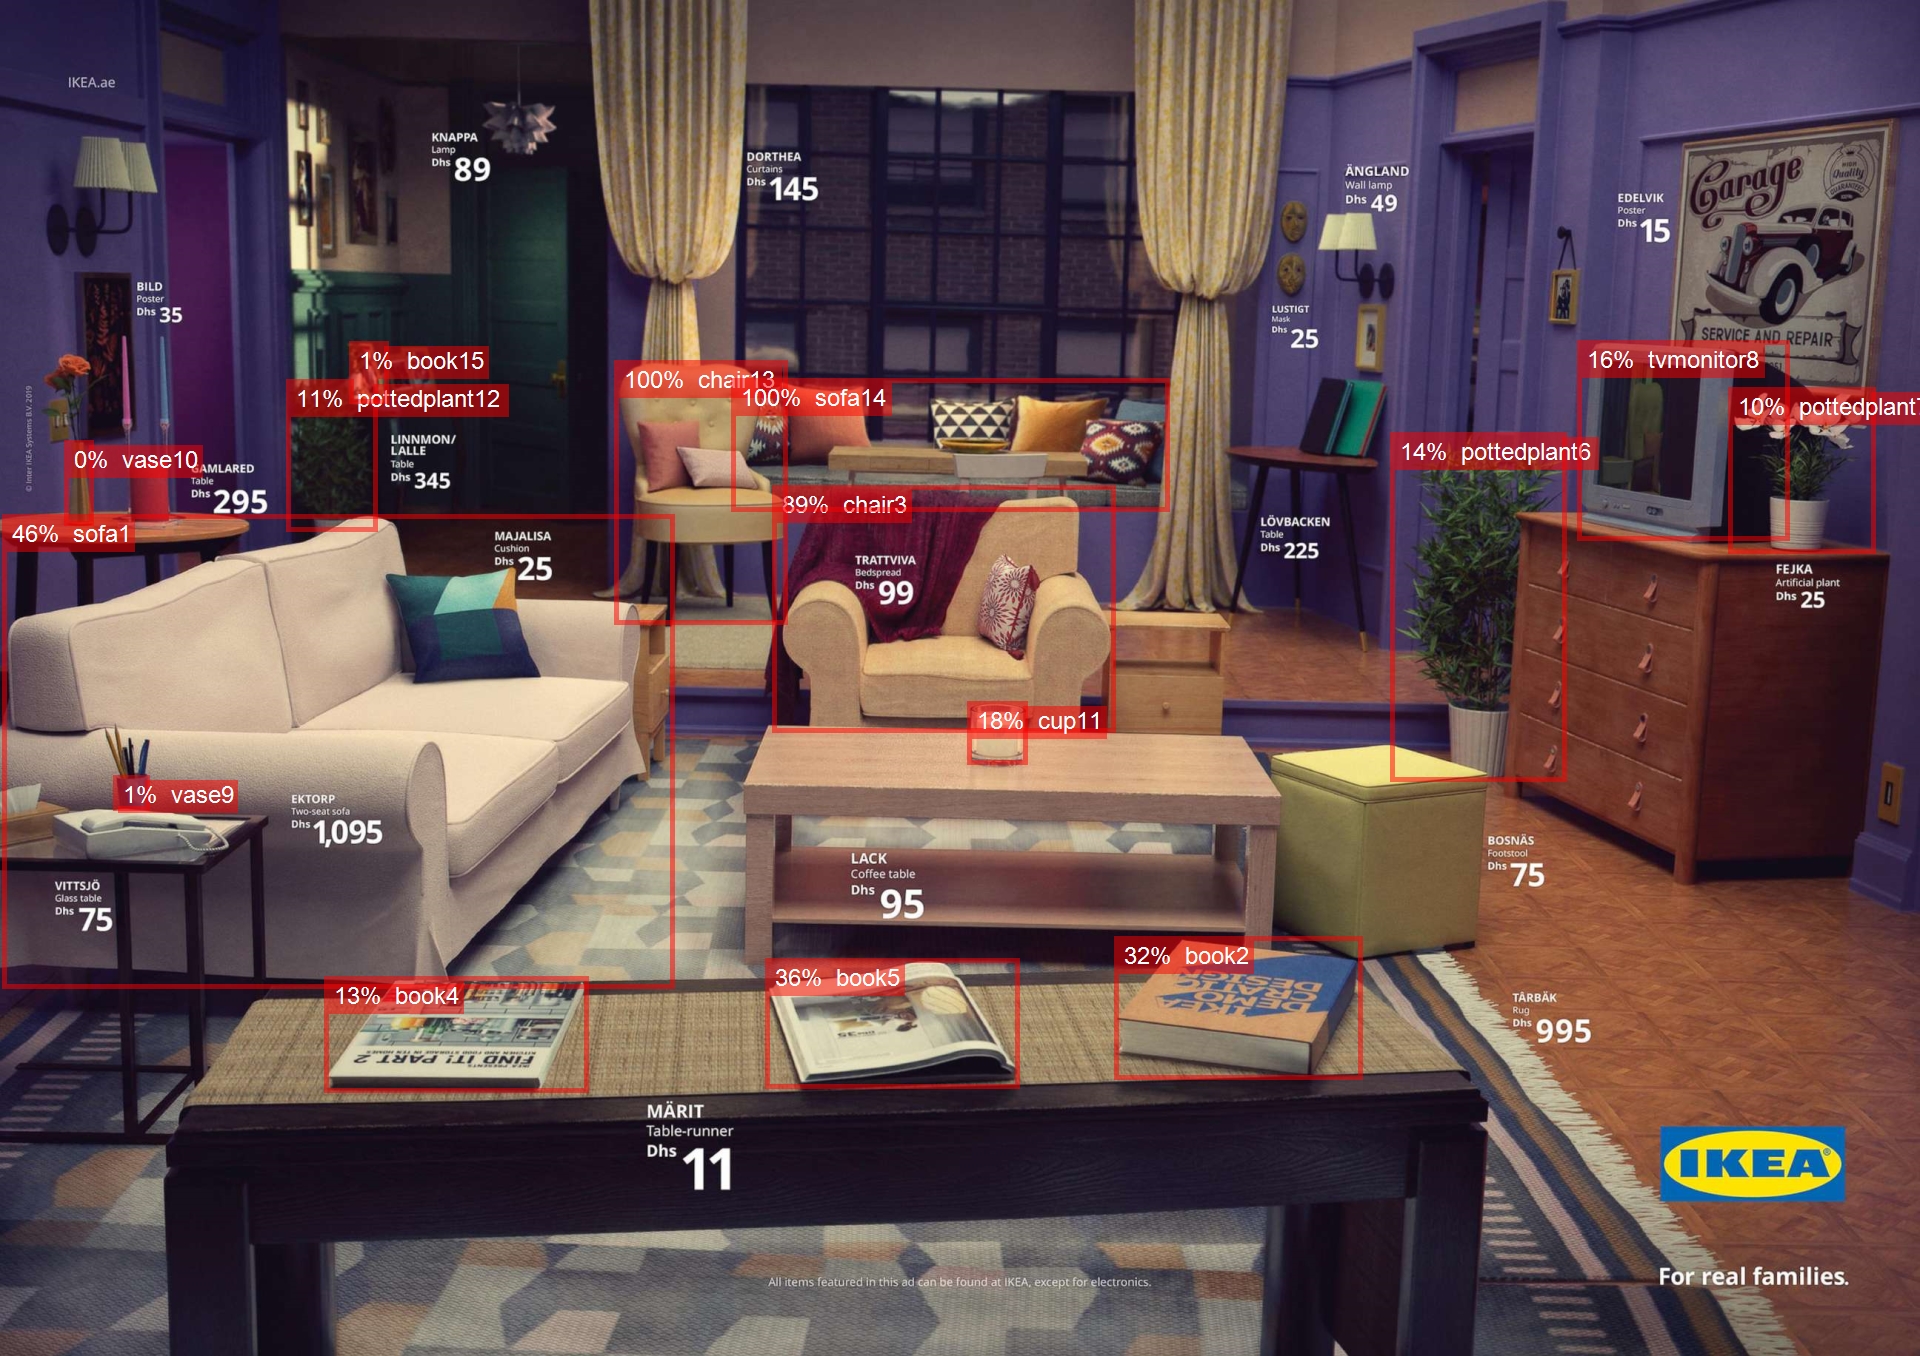
Uncover what truly captivates viewers across websites, ads, videos, signage, packaging, and any visual content.
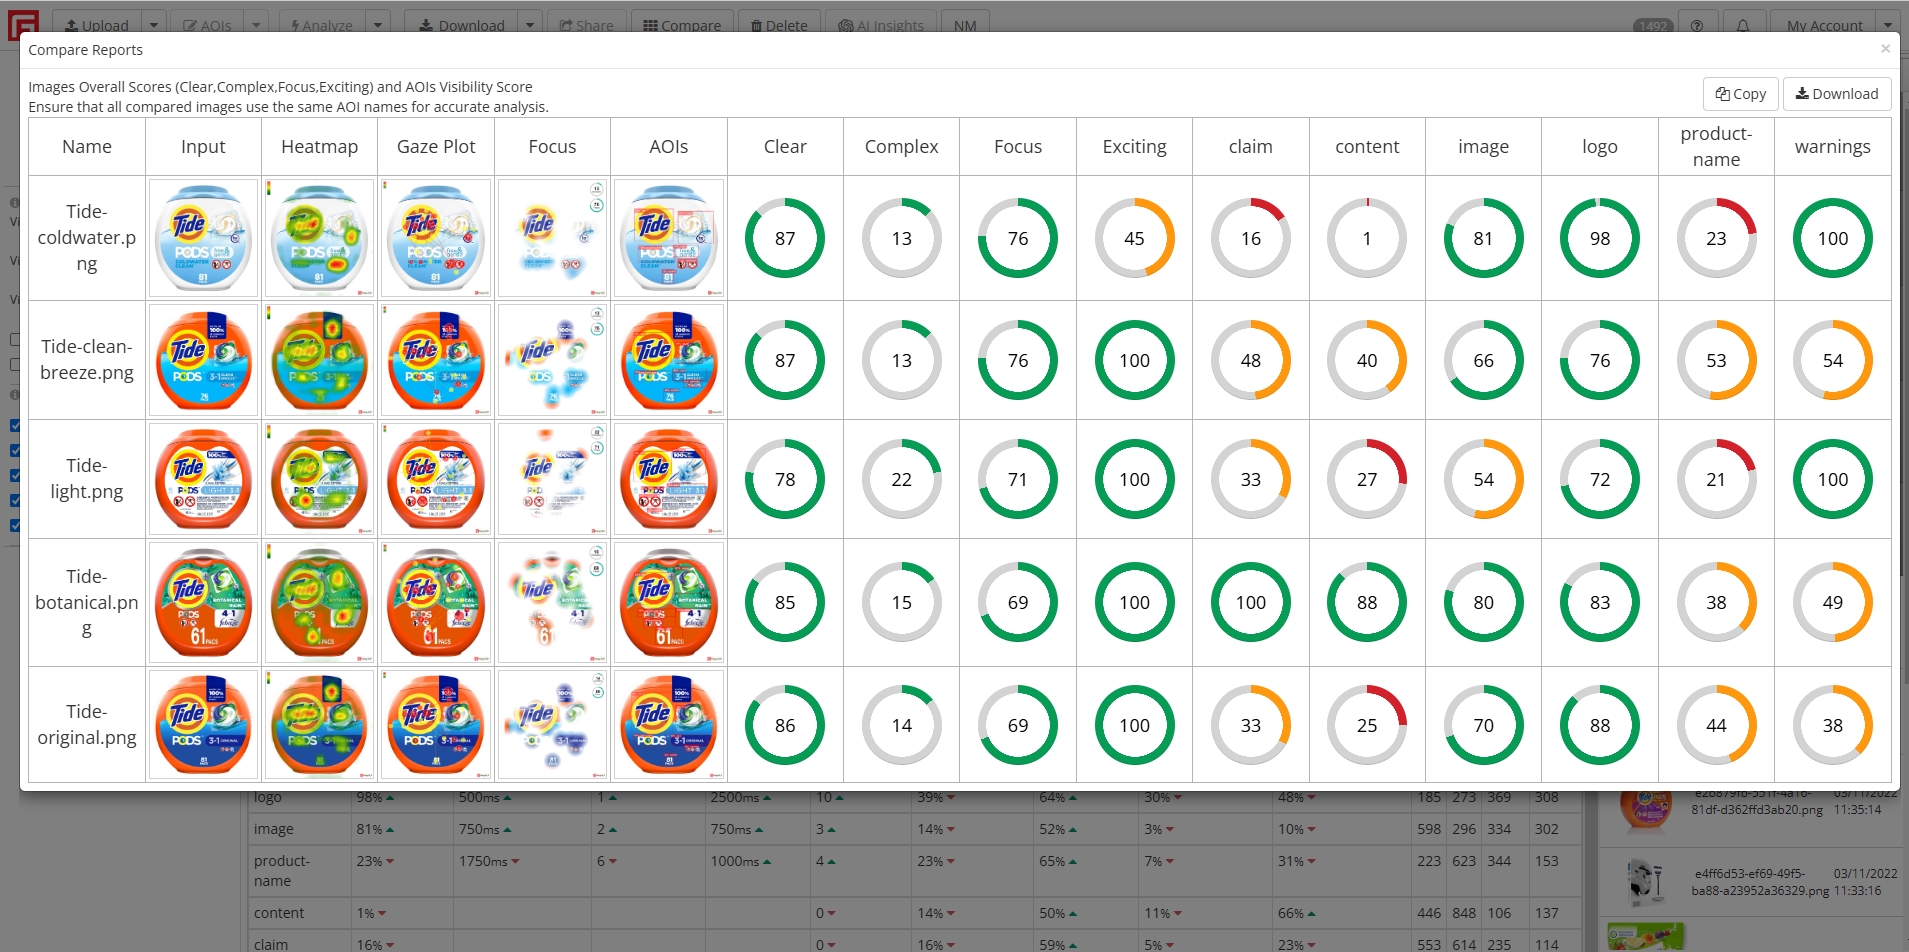
Trusted by top digital marketing and research agencies, Feng-GUI not only forecasts audience response but also enhances visual performance by analyzing attention, effectiveness, and placement to ensure maximum impact.
Start My Free Trial