Web · Ads · Video · Signage · Packaging

empowering agencies with AI since 2007

Create with Confidence, Powered by AI Insights

Feng-GUI empowers you to predict human attention and attraction with precision. Understand what will captivate viewers as they engage with your webpage, advertisement, video, signage, packaging, or any visual content.

Used by digital marketing and research agencies, Feng-GUI optimizes visual performance by analyzing attention levels, visual effectiveness, and placement to ensure maximum impact.


Start My Free Trial

Features and Benefits

Dashboard Walkthrough

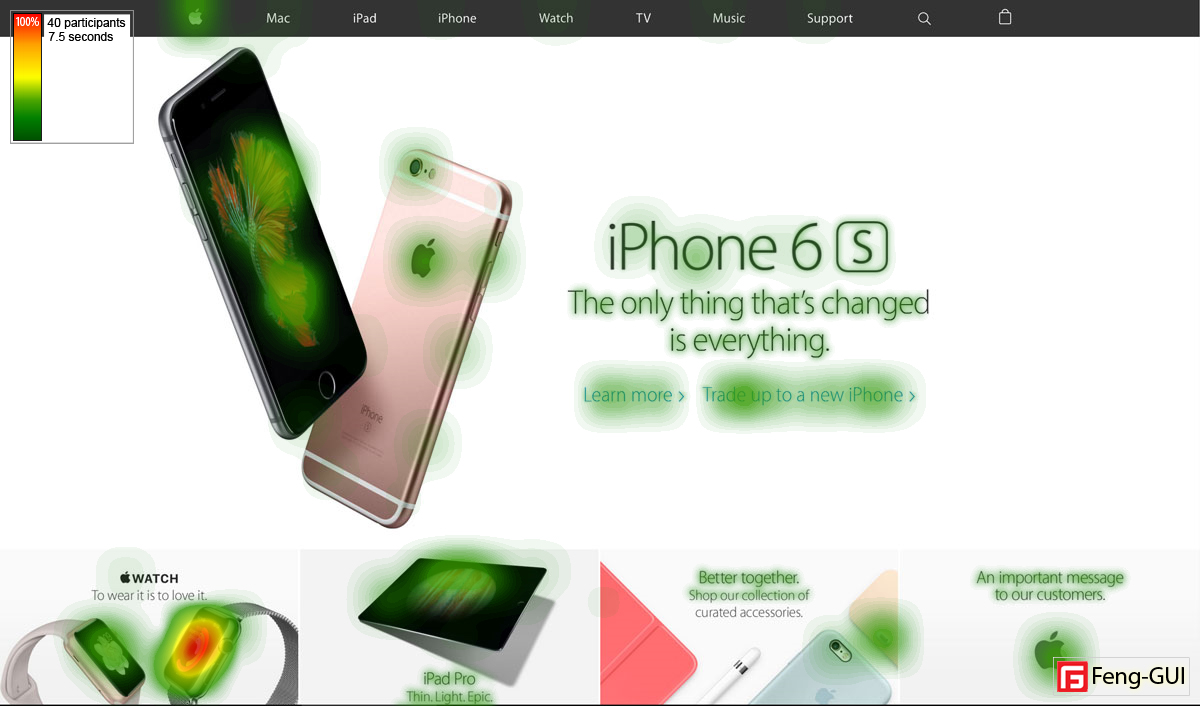
Heatmap report

The Heatmap report visually represents viewer attention dynamics within an image or video.
This visualization aids in understanding audience engagement and allows for informed decisions in content creation and optimization.
Learn more 

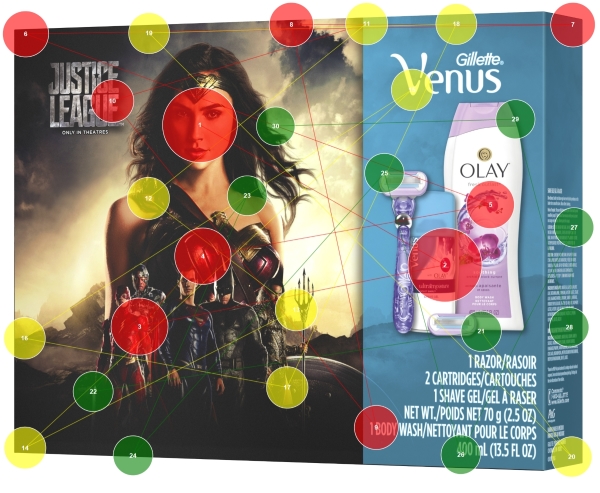
Gaze Plot report

The Gaze Plot report visualizes the scan paths and order between elements inside the image. It is made of a series of short stops (called fixations) and fast movements of an eye (called saccades).
Use the Gaze Plot report to visually demonstrate fixations order and gaze paths.
Learn more 

Focus map report

The Focus map report tones down information that is not attractive and visually displays what your viewers may perceive during the first few seconds of visual inspection.
Use the Focus Map report to identify which areas are being perceived and which are being ignored.
Learn more 

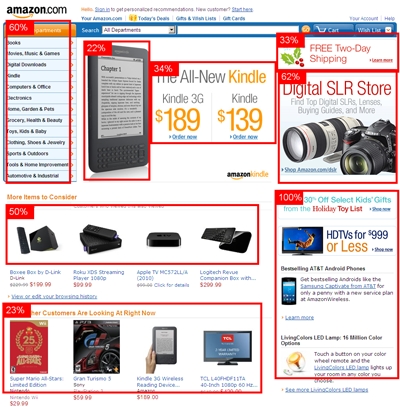
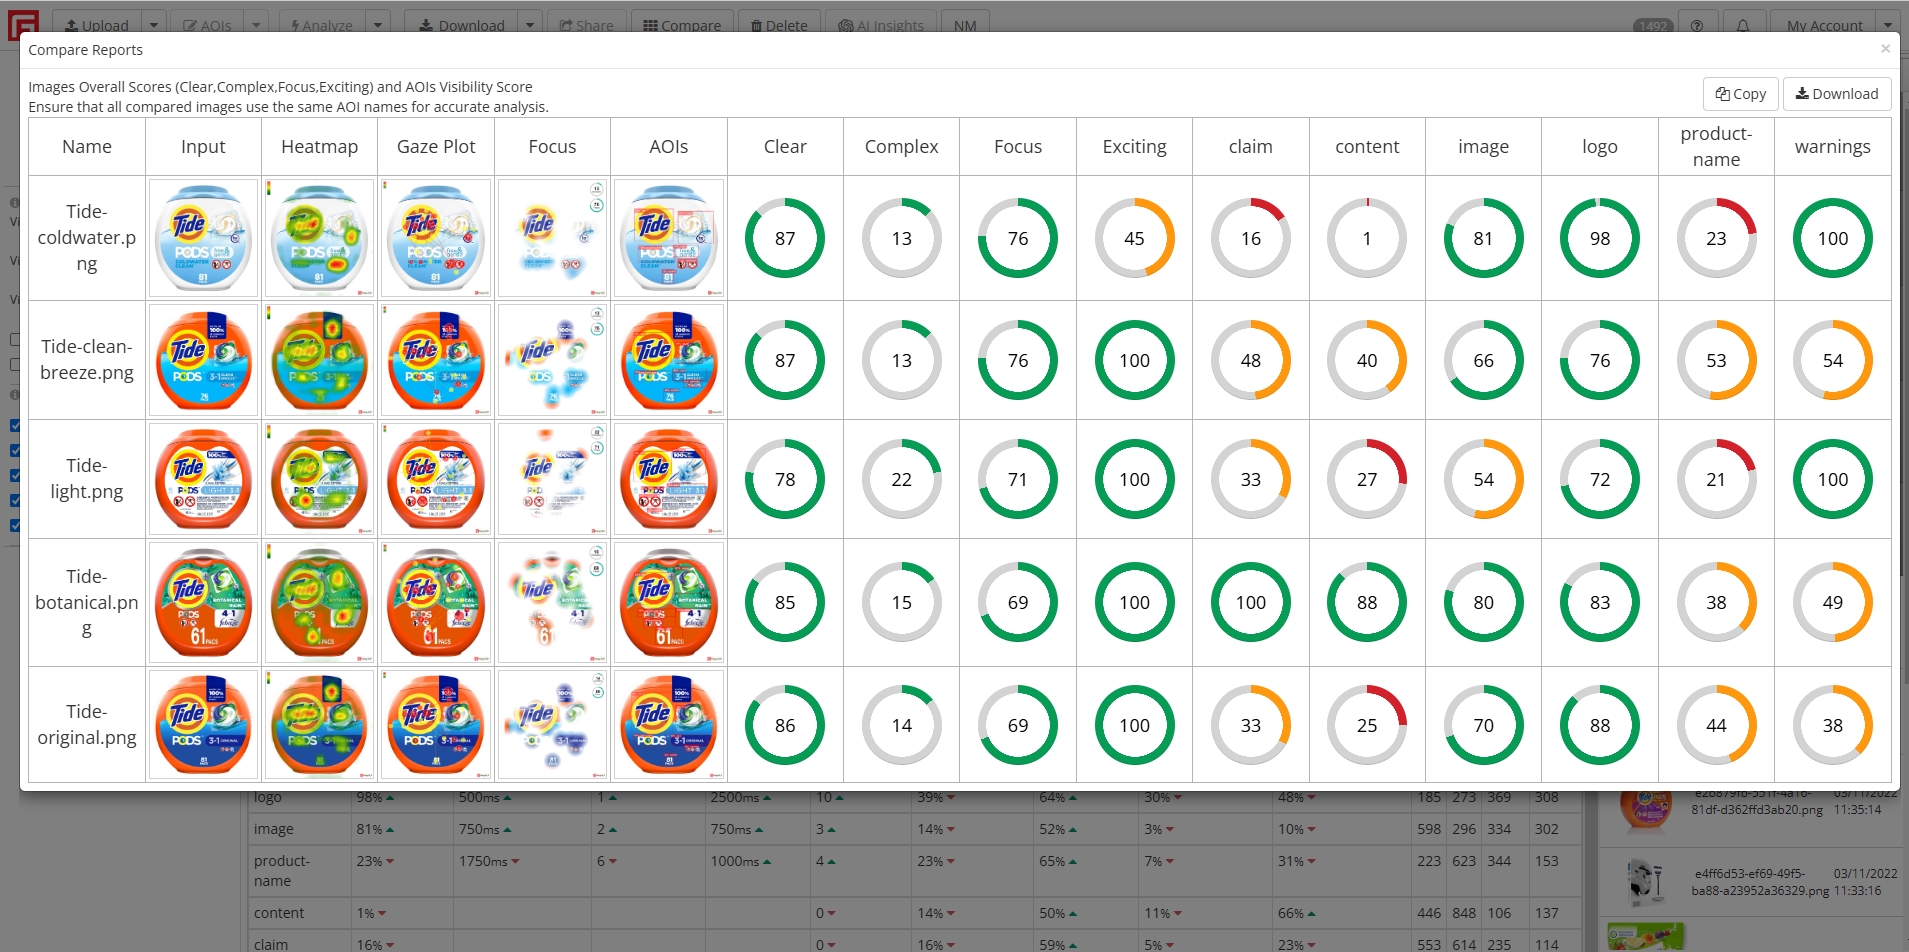
Areas of Interest report

The Areas of Interest report (AOIs) lets you define areas inside the image and determine the percentage of the attention this area is drawing.
Use the Areas of Interest report to compare results between different versions of your design and layout.
Learn more 

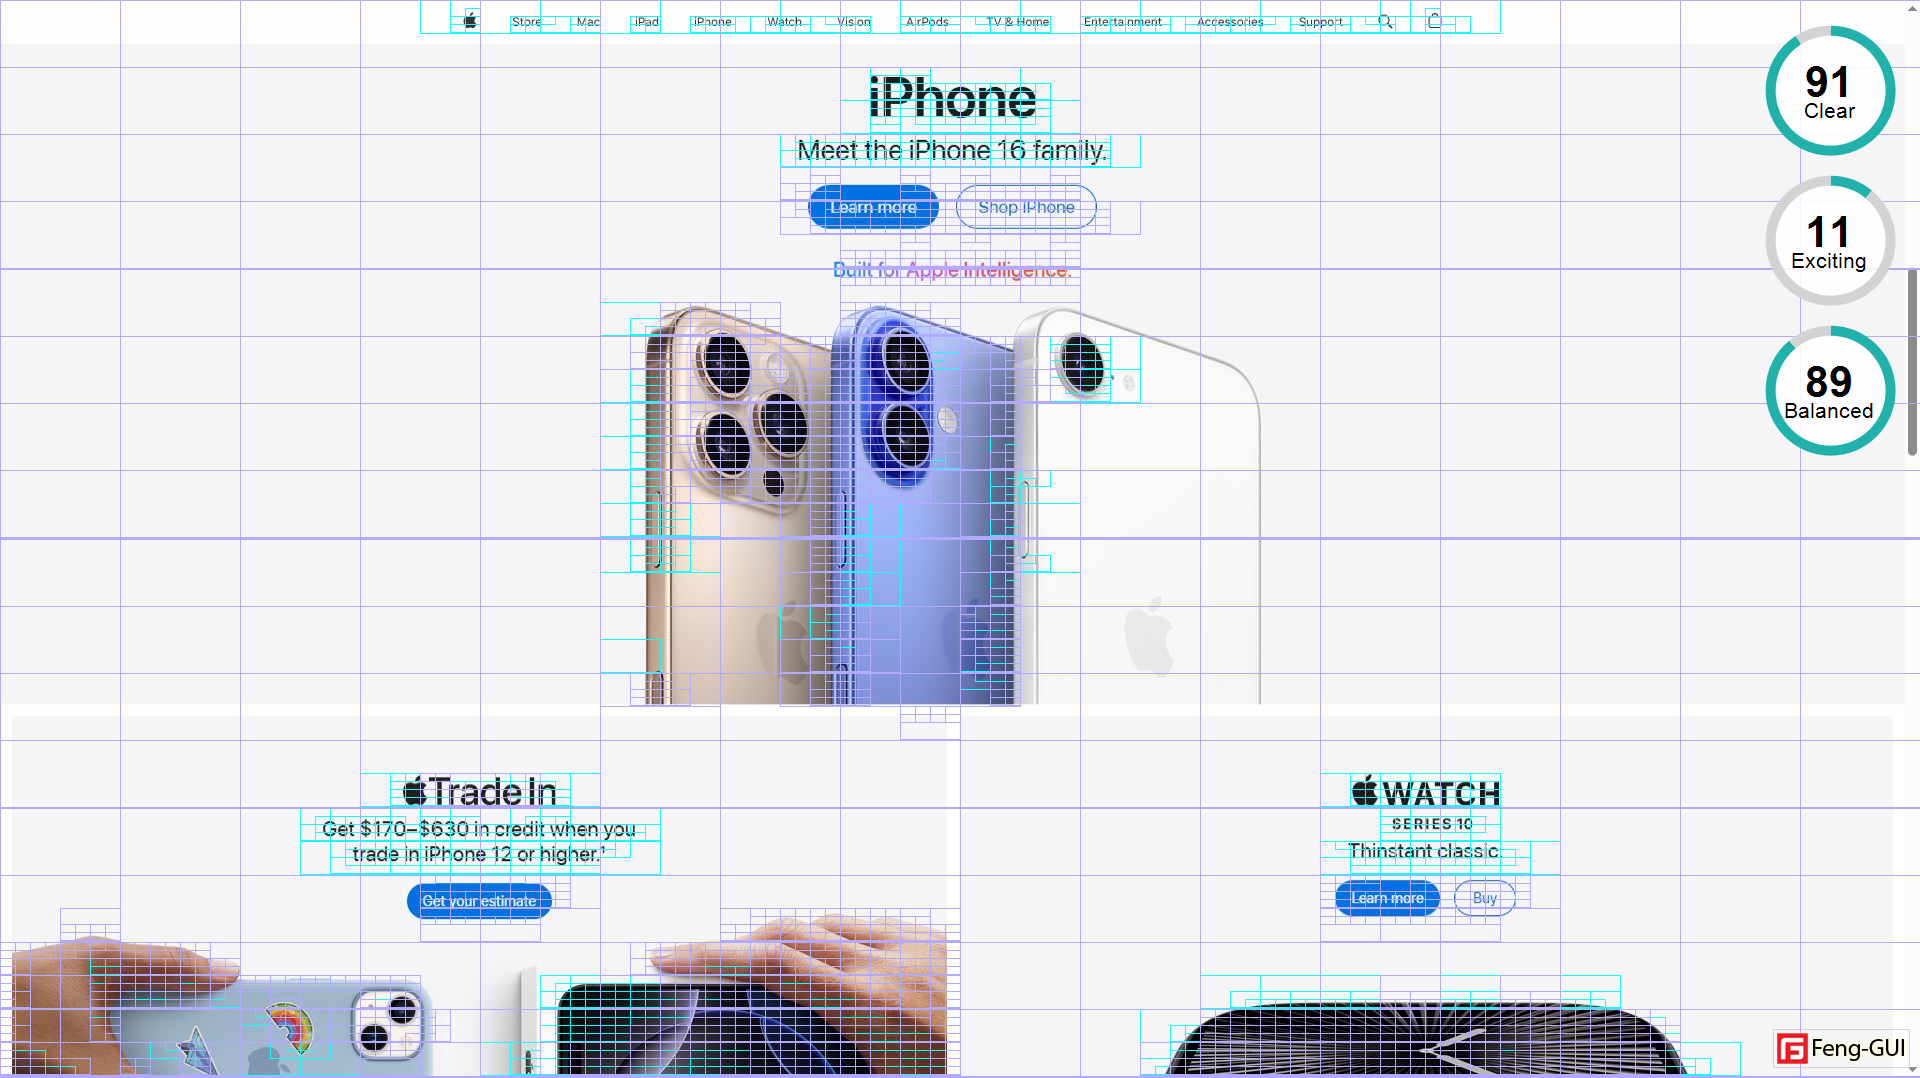
Aesthetics report

Aesthetics report enables you to examine the emotional aspects of aesthetics.
Based on large scale studies with millions ratings of visual appeal collected from nearly 10 thousand participants, we developed computational models that accurately measure the perceived Clarity and Excitingness.
Learn more 

Video reports

Video analysis reports videos are: heatmap video, Focus map video and Gazeplot video in Bee swarm style.

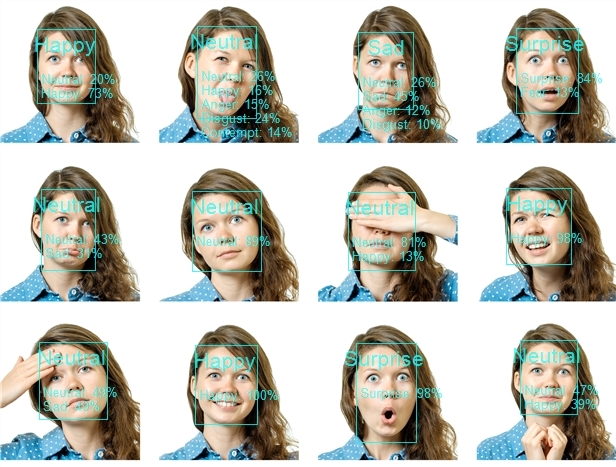
Facial Expressions Report

Facial expressions report describes the level of 8 expressions for each detected face. Expressions are: Neutral, Happy, Surprise, Sad, Anger, Disgust, Fear and Contempt.
Learn more 

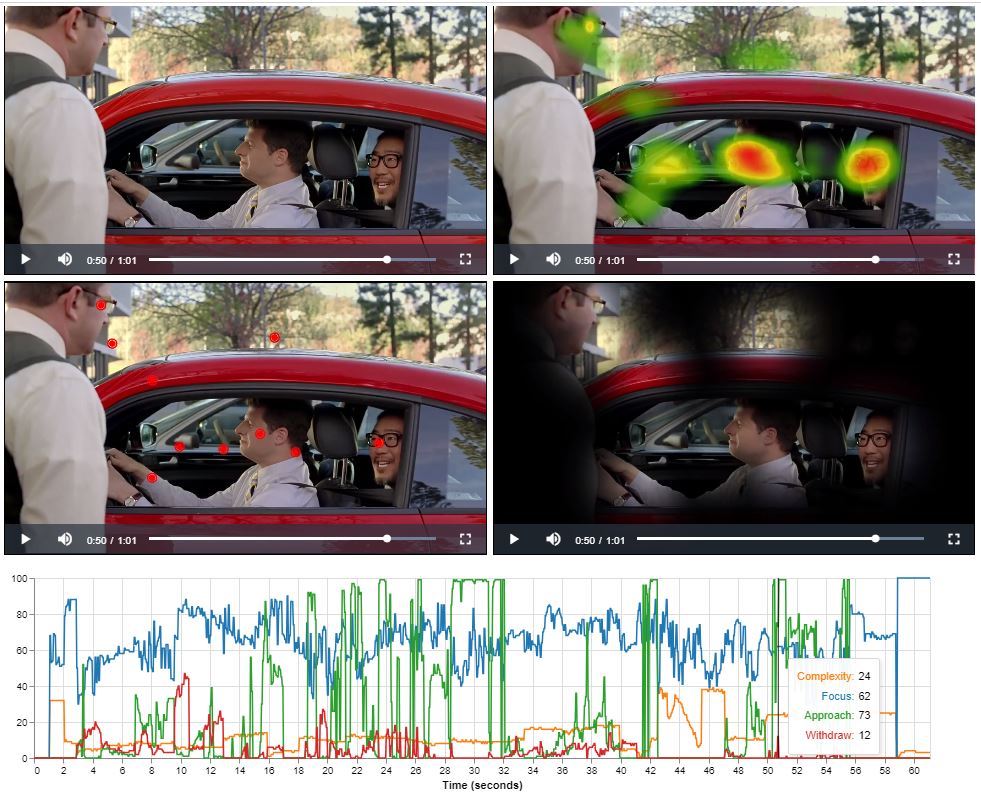
Emotions chart

This visualization helps identify viewer behavior patterns and key moments, aiding in the optimization of video design and storytelling techniques for better viewer experience.
Analyzing a video frame by frame involves extracting Focus, Complexity, Approach, and Withdraw scores to understand viewer attention and engagement. Learn more 

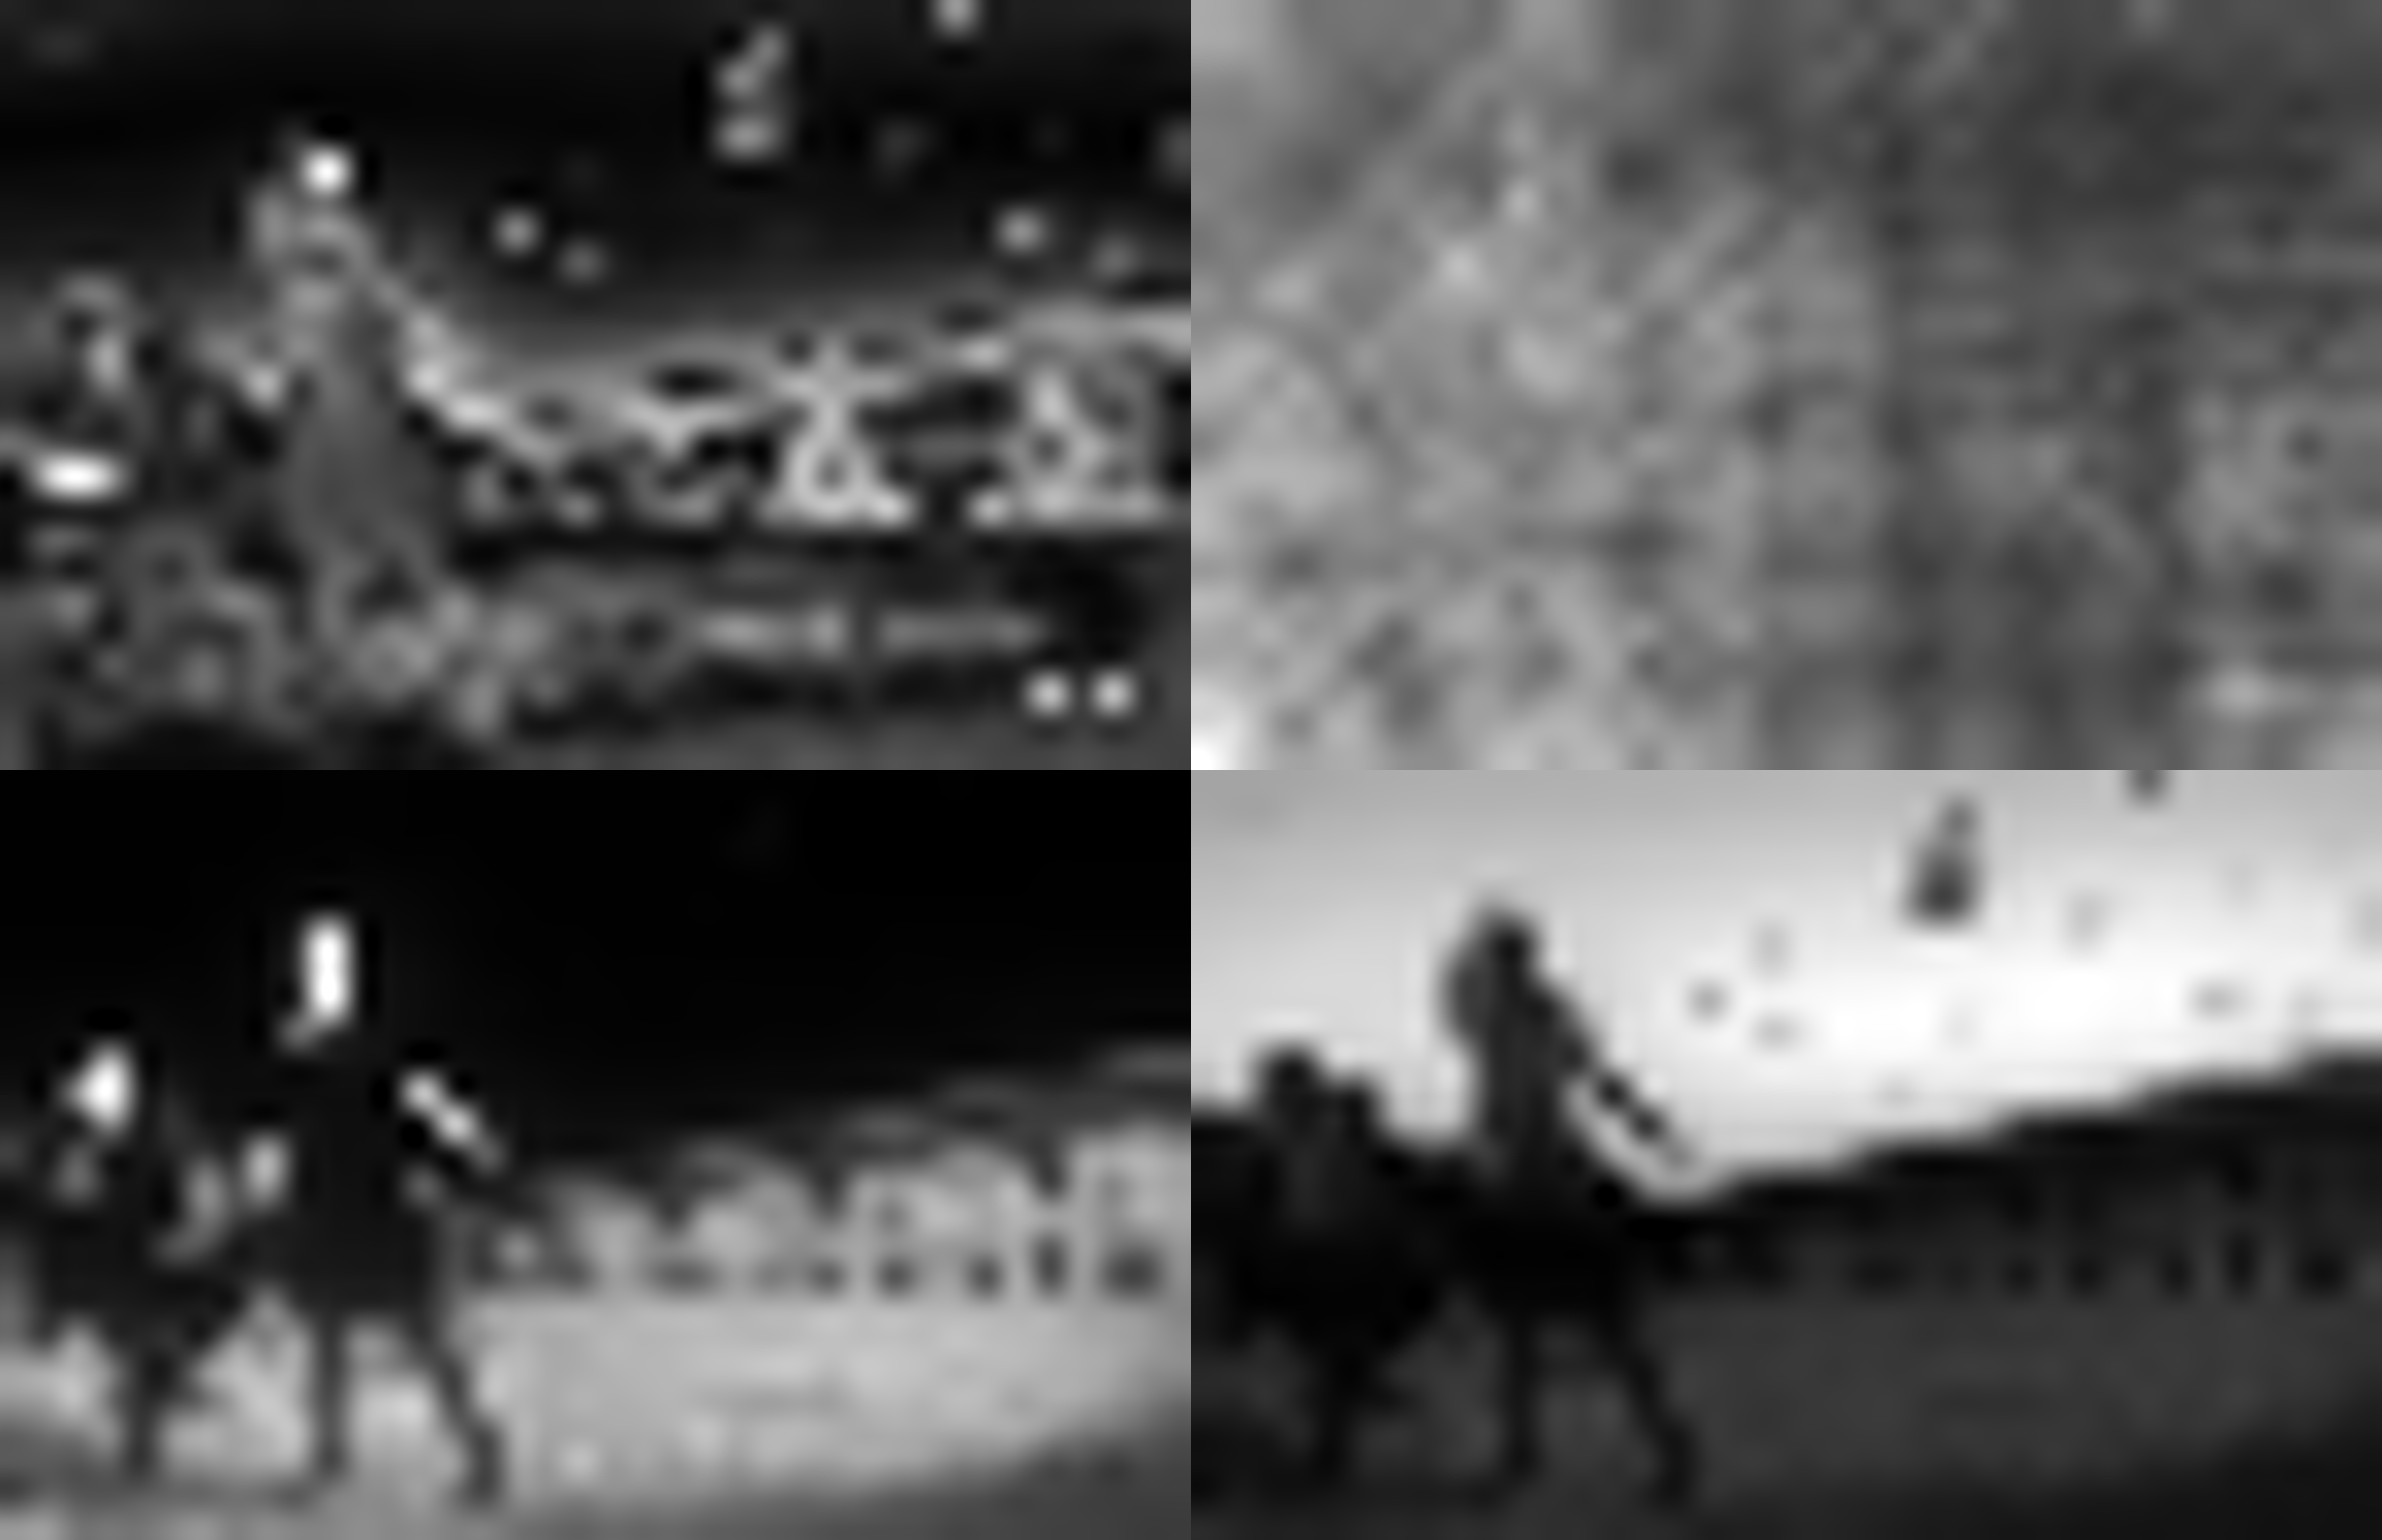
Visual Features Report

Visual Features are major contributors to the calculation of visibility score.
Drawing attention requires the object to have a significant contrast from surrounding objects and background.
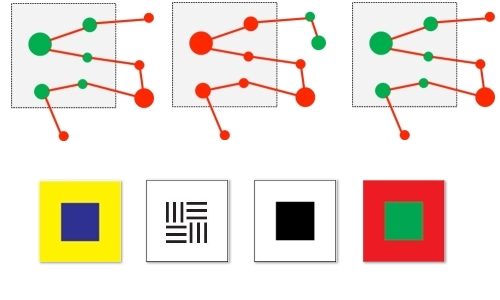
The Visual Features report is a combo image of 4 reports:
intensity (top left), orientation and edges (top right), red/green color contrast (bottom left) and blue/yellow color contrast (bottom right).

Eye Tracking Metrics


Detailed Fixations and Visual Features data for each Area of Interest:
Visibility Score, Time To First Fixation, Fixations Before, Fixation Length, Fixation Count, Intensity Features, Edges Features, Red Green Contrast and Blue Yellow Contrast.
Learn more 

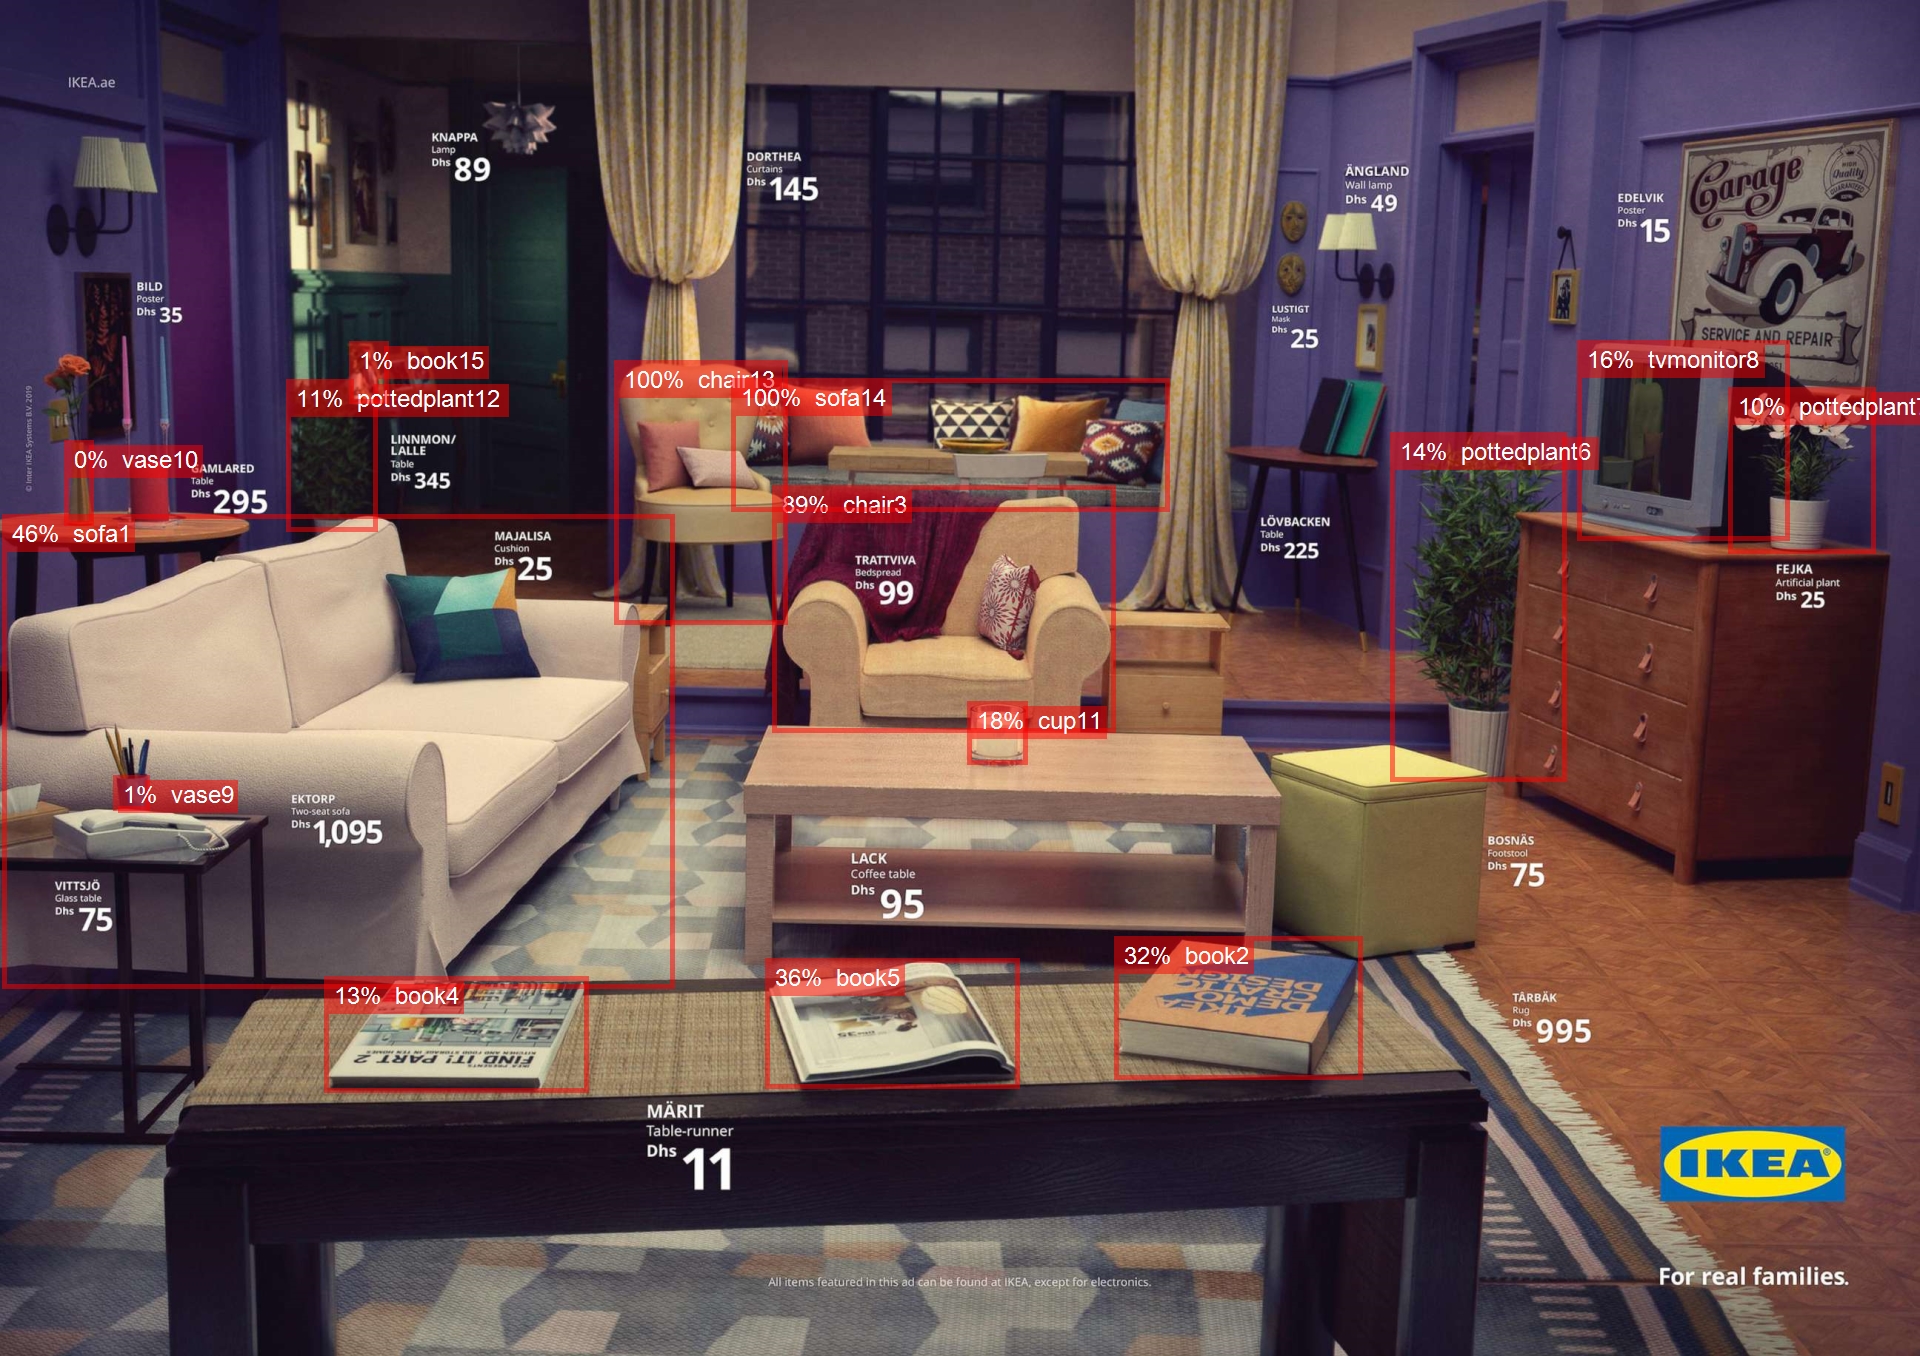
Automatic Object detection and identification

Automatic creation of Areas of Interest (AOIs) using object detection algorithms works by identifying key objects or elements in an image, such as faces, products, or text, using machine learning models. Learn more 

OpenAI Insights and Recommendations

Unlock key insights effortlessly using OpenAI's Insights and Recommendations. Streamline data analysis and decision-making with concise and valuable summaries. Present the findings in a clear and actionable manner.

Export Data

Export the reports data to third party software for custom analysis.
Export reports data as raw image, json and csv formats.

Features Comparison

Feng-GUI dashboard comes in three different flavors:
Basic, Business and Enterprise.
Here are the differences.


Feature \ Plan Basic Business Enterprise
General
Number of Users 5 Users25 Users100 Users
Team Sharing
Analysis Up to 200 analyses monthlyUp to 2400 analyses annuallyUp to 10000 analysis annually
Accuracy vs. eye-tracking 92%92%92%
Data Storage
3 months1 year1 year
Input
Image analysis
Website capture
Video analysis
Input file maximum size5 MB100 MB100 MB
Analyze
Basic visual features
Extended visual features
Flicker and Motion (in video)
Face detection, frontal and profile
Skin detection
Text detection, in any language
Custom view type
Custom view distance
Custom view duration
Auto create AOIs
Object detection and identification
Reports
Heatmap report
Gaze Plot report
Focus Map report
Areas of Interest report
Aesthetics report
Visual Features Report
Facial Expression report
Visibility Score, Clarity Score, Excitingness Score, Balanced Score
Complexity and Focus Scores
Emotions Chart
Insights and Recommendations using OpenAI
Customization
Custom Watermark
Custom Report template
Raw Analysis Data
API integration
White label