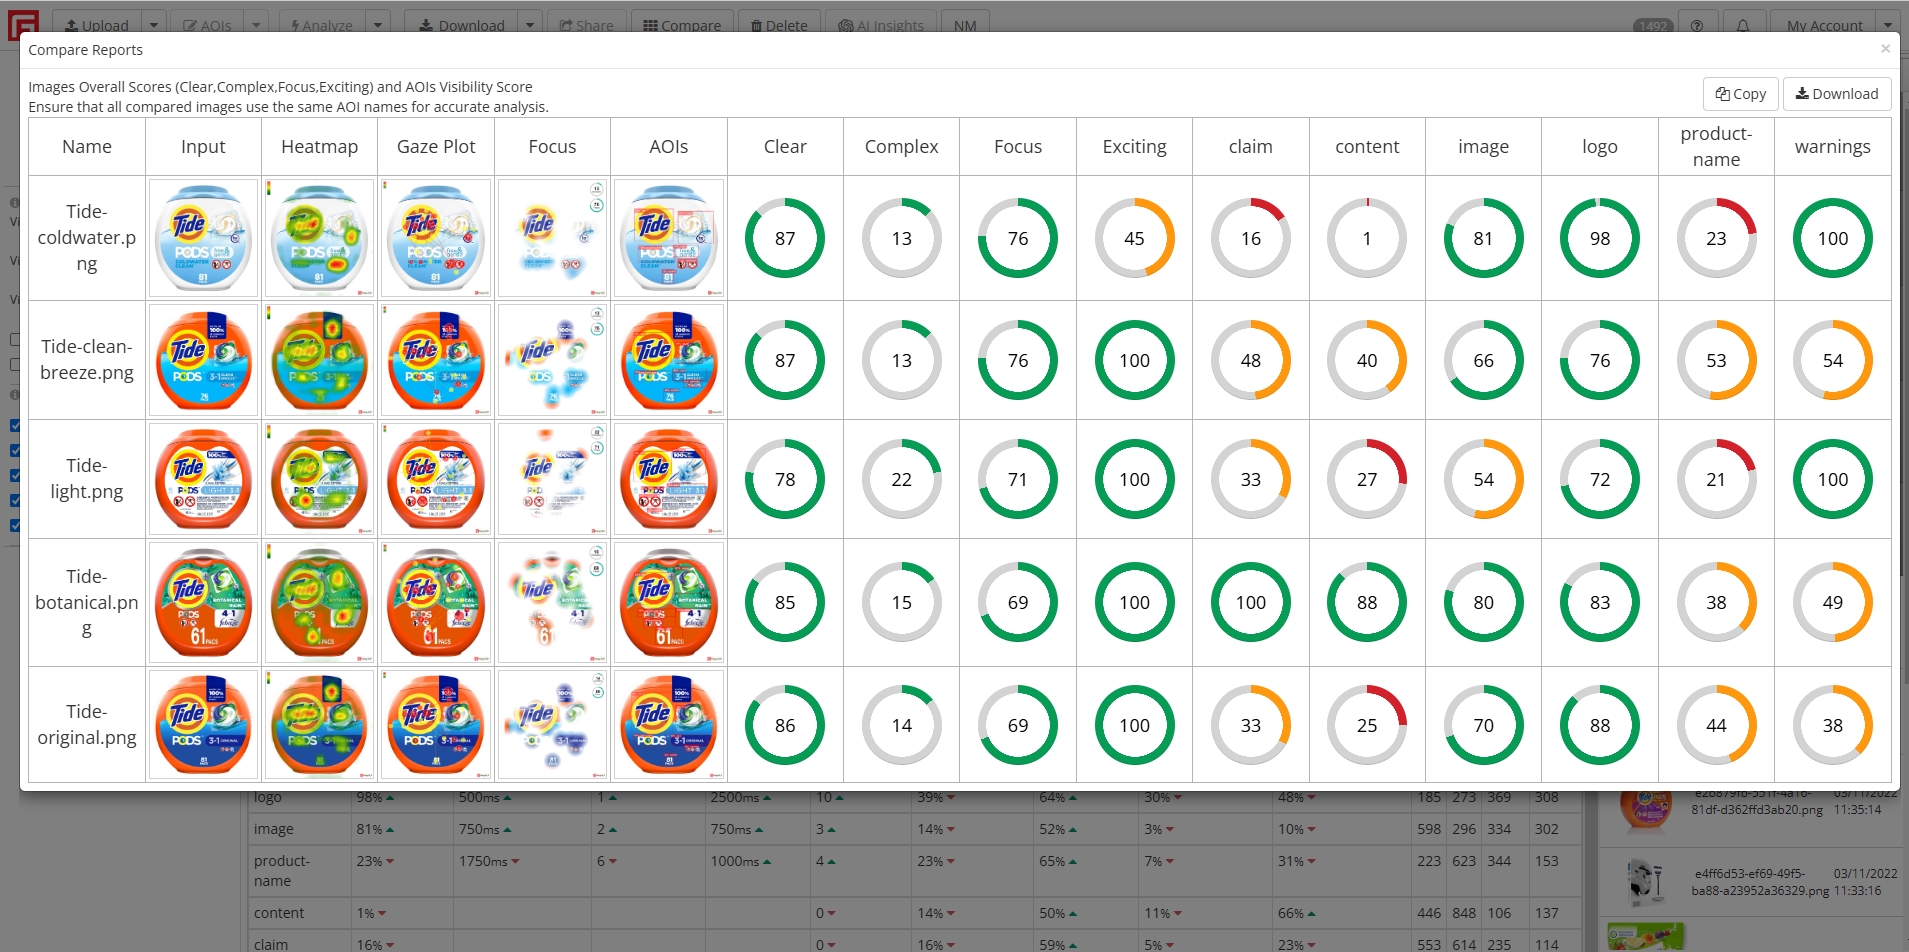
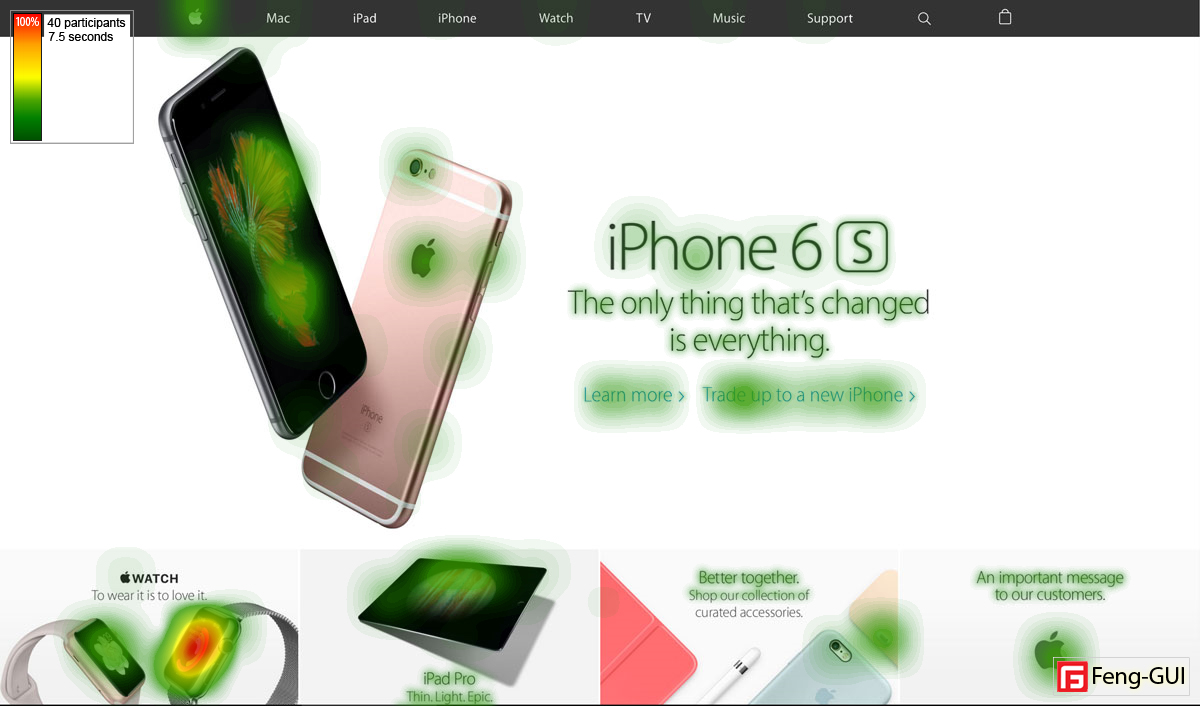
Interpreting the results:
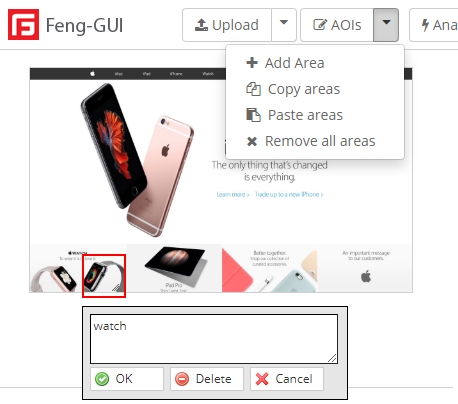
If the AOI Visibility Score is low, not visible enough, and you wish to increase the score and make the object more prominent,
the visual features gives you cues about how to achieve that.
Inspect which visual feature of this AOI is low and change its design to make it higher.
Design change can be done by changing intensity (dark/light), orientation (change angle of the object),
adding or reducing complexity (shapes, edges, texture and text), color contrast (red/green or blue/yellow) adding or removing faces.
 |
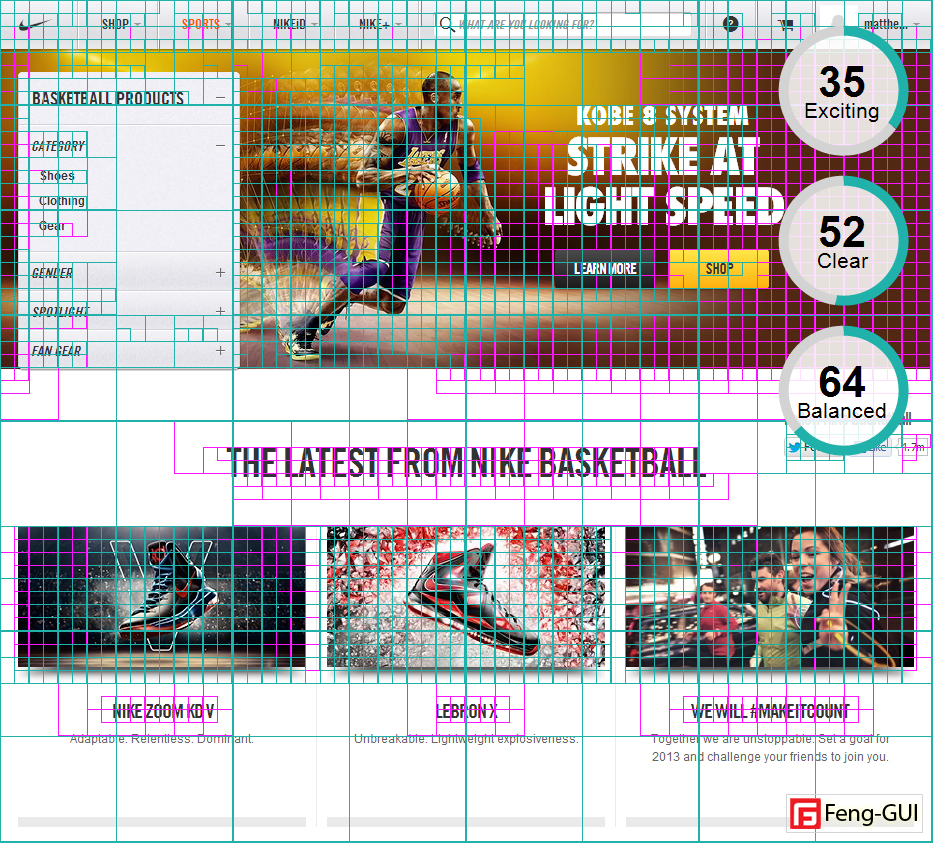
Intensity Features
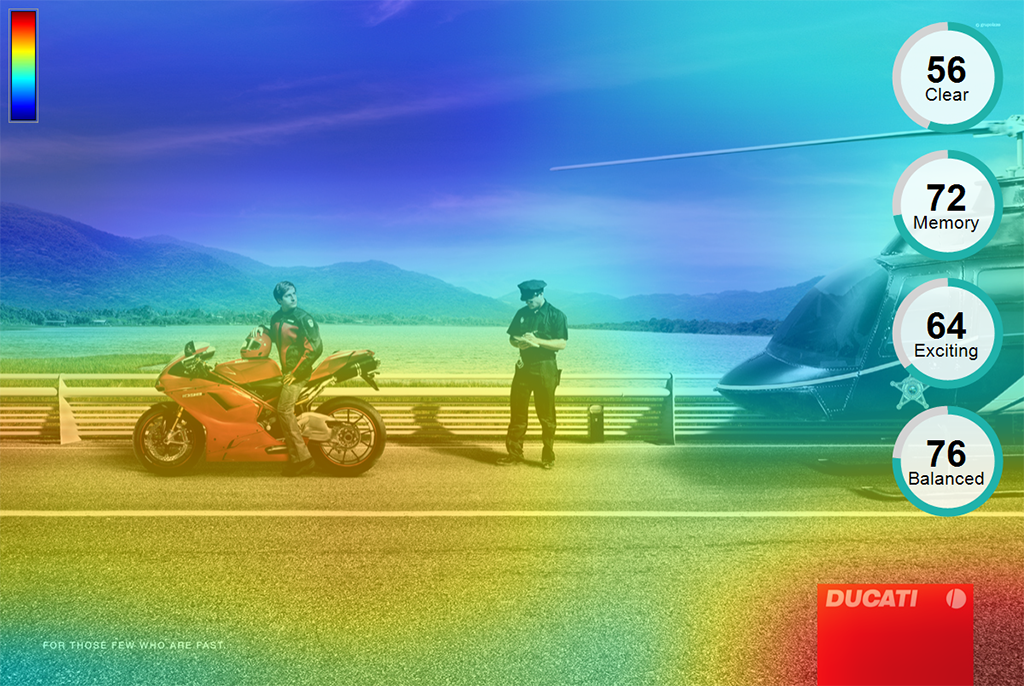
Intensity score measures the visual strength of an AOI by analyzing its contrast, brightness, and saturation levels.
A higher score indicates a bold, attention-grabbing area, while a lower score suggests a softer, less prominent region.
|
 |
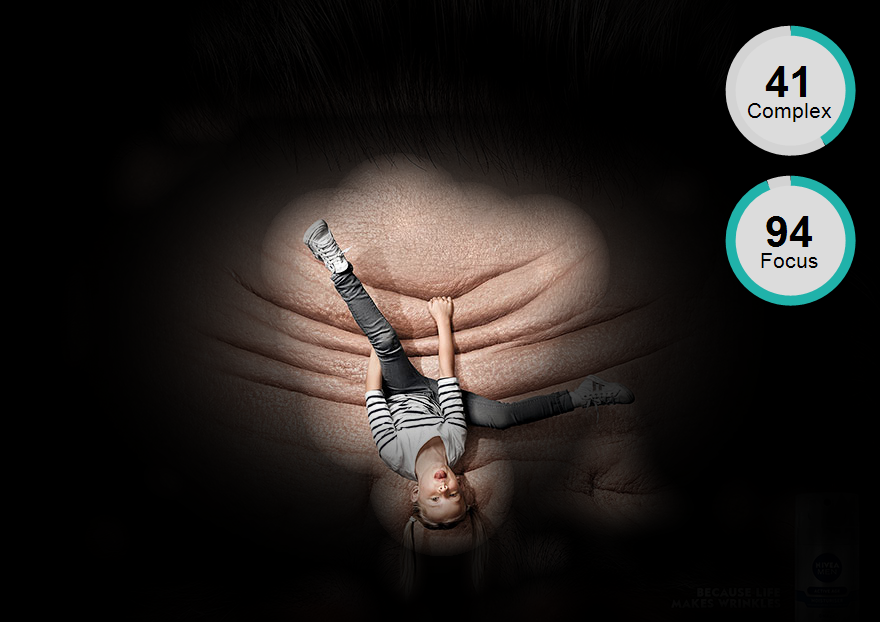
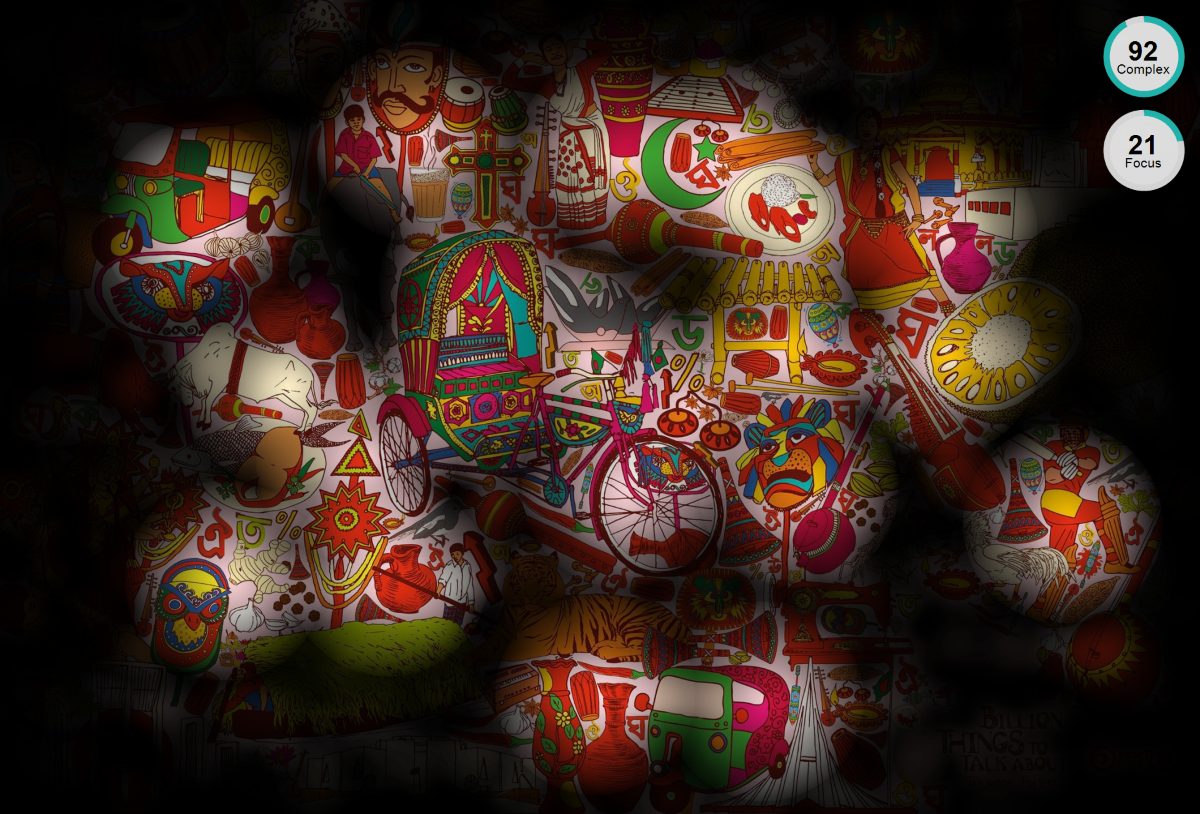
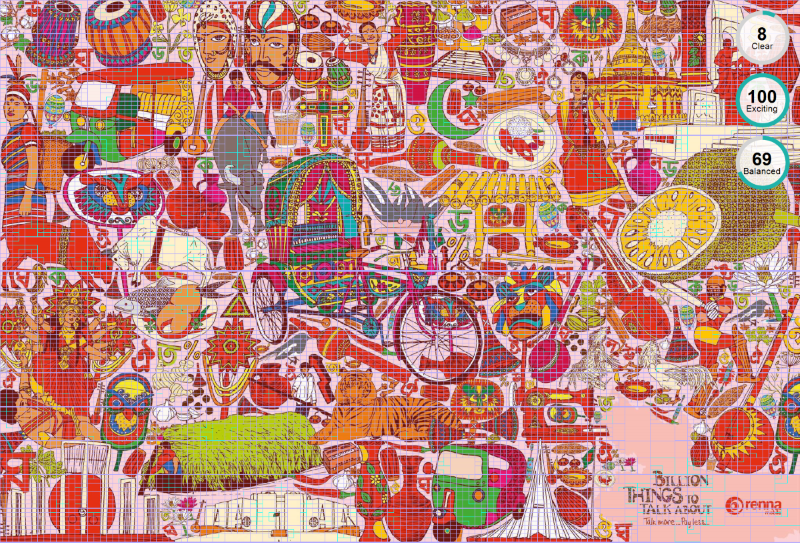
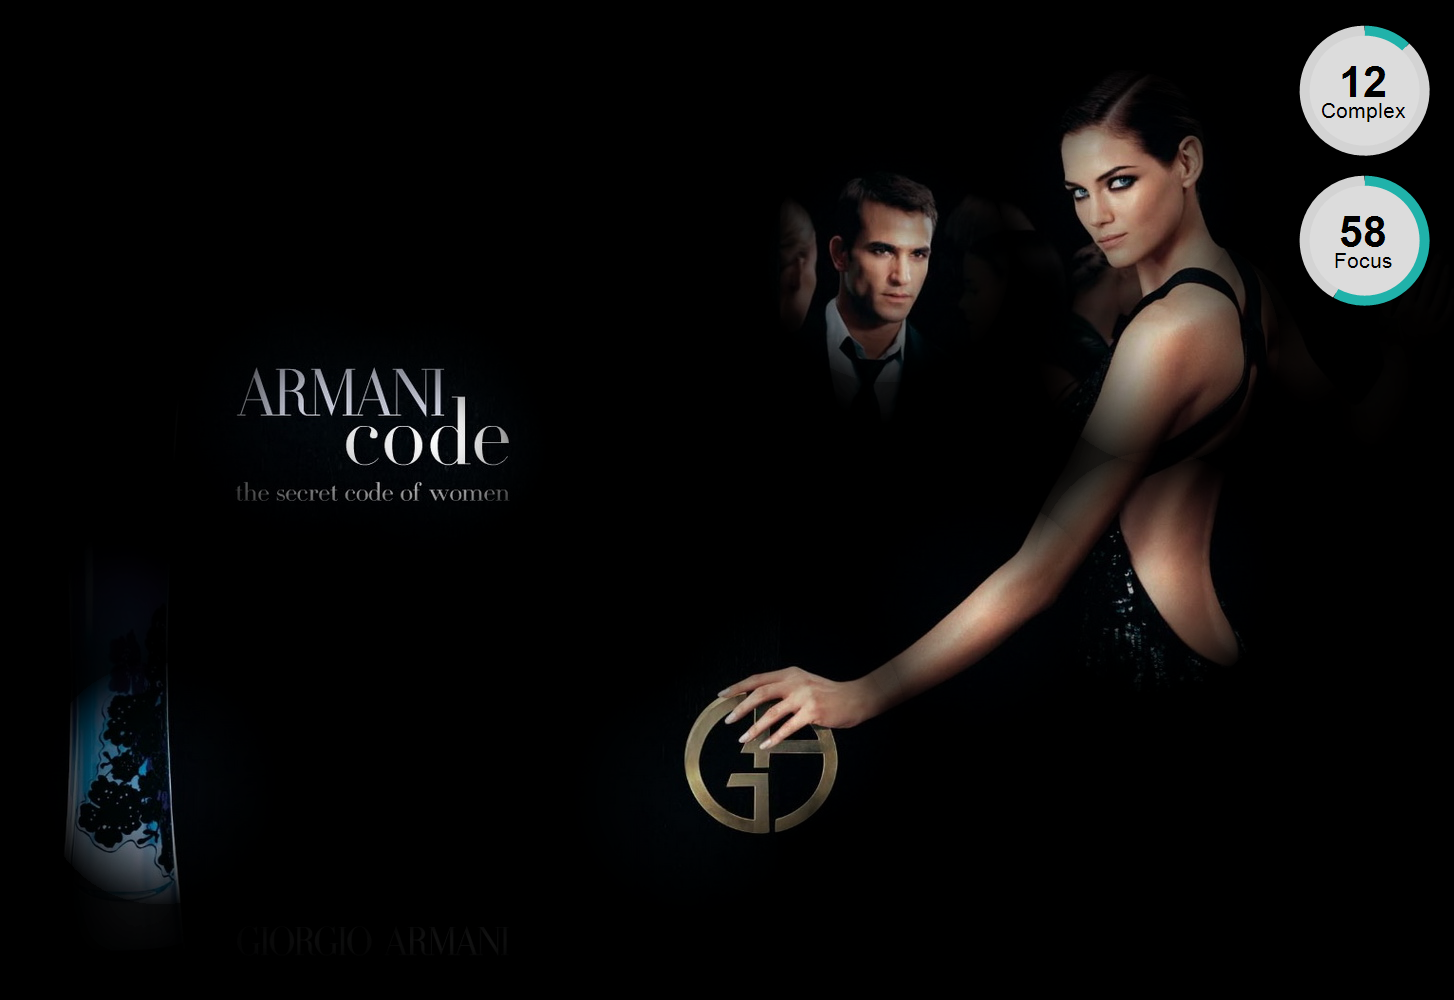
Complexity Features
Complexity Score measures the amount of texture detail within an AOI by analyzing lines, contours, text, and sharp transitions.
A higher score indicates a region with strong, well-defined texture, which can attract visual attention but may also contribute to visual clutter and noise.
A lower score suggests a smoother, less detailed area, which can enhance clarity but may reduce emphasis on that region.
|
 |
Red Green Contrast
Red-Green Contrast measures the visual difference between red and green tones within an AOI.
Higher contrast indicates a strong distinction between these colors, which can enhance visibility and draw attention.
Lower contrast suggests a more blended or neutral color balance, making the AOI less visually distinct.
This contrast is important because red and green are opposing colors in human vision, influencing perception, readability, and focus.
|
 |
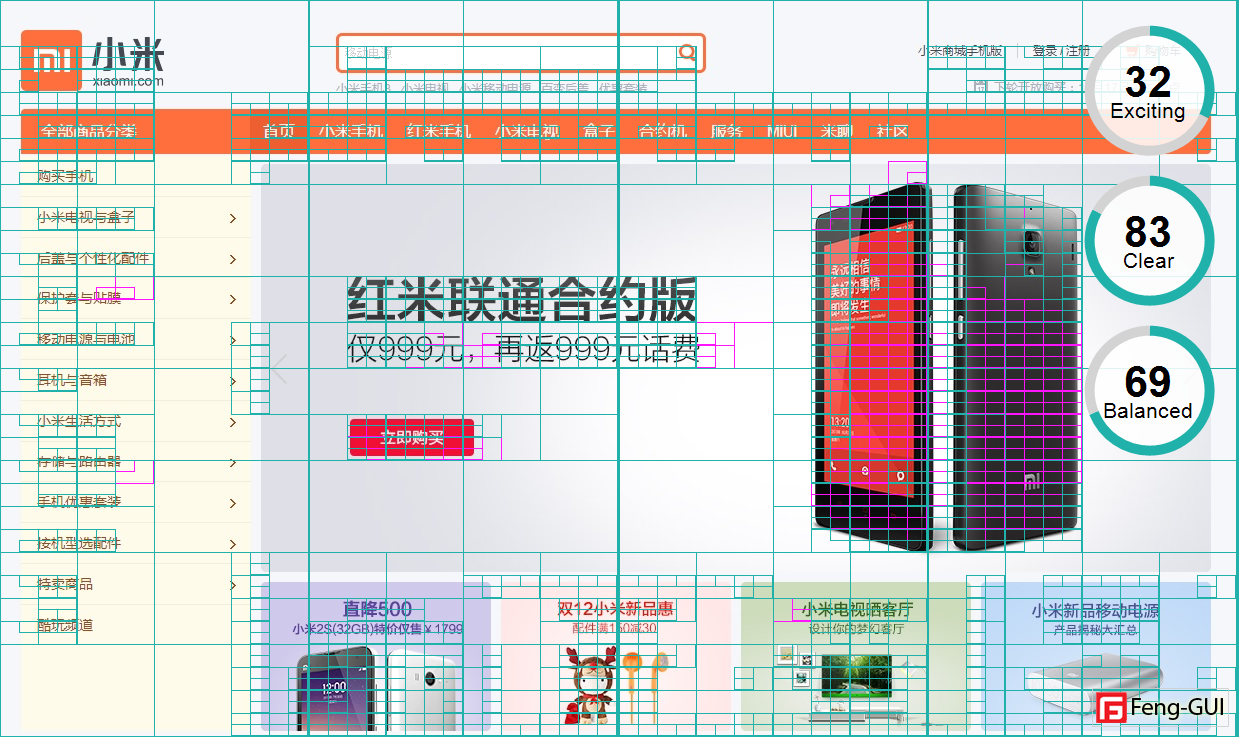
Blue Yellow Contrast
Blue-Yellow Contrast measures the visual difference between blue and yellow tones within an AOI.
A higher contrast indicates a strong distinction between these opposing colors, making the area more visually striking and attention-grabbing.
A lower contrast suggests a more blended or neutral color balance, reducing the AOI’s visual prominence.
This contrast is significant because blue and yellow sit opposite each other in the human visual system, influencing perception, depth, and visual appeal.
|
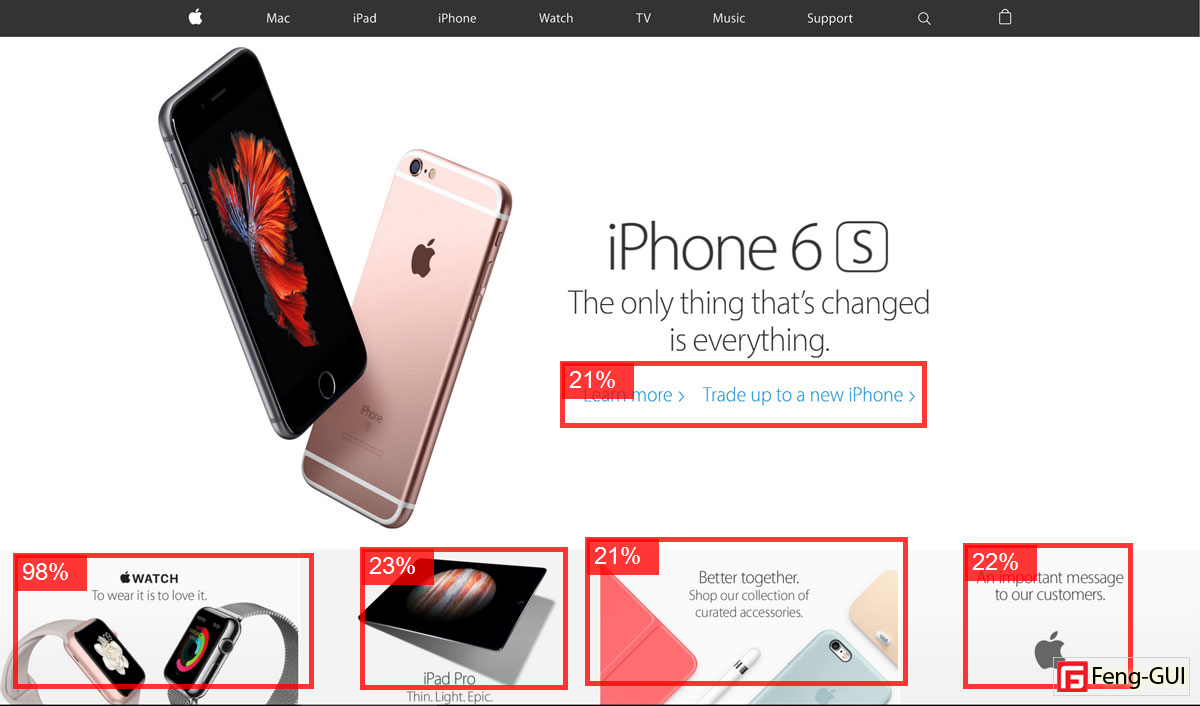
Improving the results:
A high contrast between an element and its surrounding will increase the element's visibility.
Intensity - Increasing brightness increases intensity.
Complexity - Adding edges, lines, contours, texture and text will increase complexity value
Color - Measure the color contrast of an AOI element and alter it to reduce or induce its visibility.
- Identify the dominant color of the element (foreground) and the dominant color of its surrounding (background).
- Measure the color contrast ratio of the two colors.
- Change the element or its background luminance to increase or decrease the color contrast ratio.
To increase Red–Green contrast, adjust hue direction:
Increase separation along the red ↔ green axis
Move one color toward red/orange
Move the other toward green/cyan
To increase Blue–Yellow contrast, adjust warmth and lightness:
Increase separation along the blue ↔ yellow axis
Cool one color (blue/navy)
Warm or brighten the other (yellow/cream/off-white)
Color Contrast ratios can range from 1 to 21 (commonly written 1:1 to 21:1).
Minimum contrast for reading text is 4.5:1
The contrast of black foreground over a white background is 21:1
Color Contrast ratio calculators
https://contrastchecker.com
contrastchecker tool also include a color quantization.
contrast checker/
Color picker browser extension
https://www.colorzilla.com/chrome/
Color Quantization tools:
To identify the colors inside the image, you can use color quantization tools:
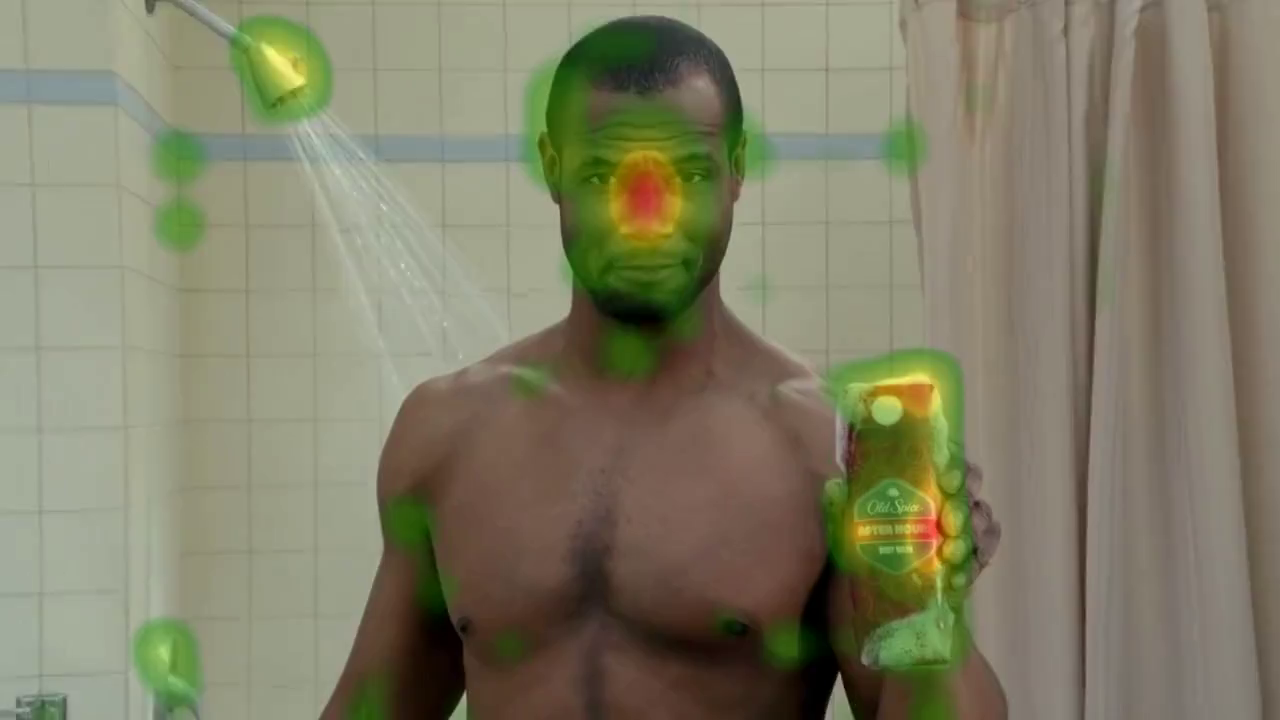


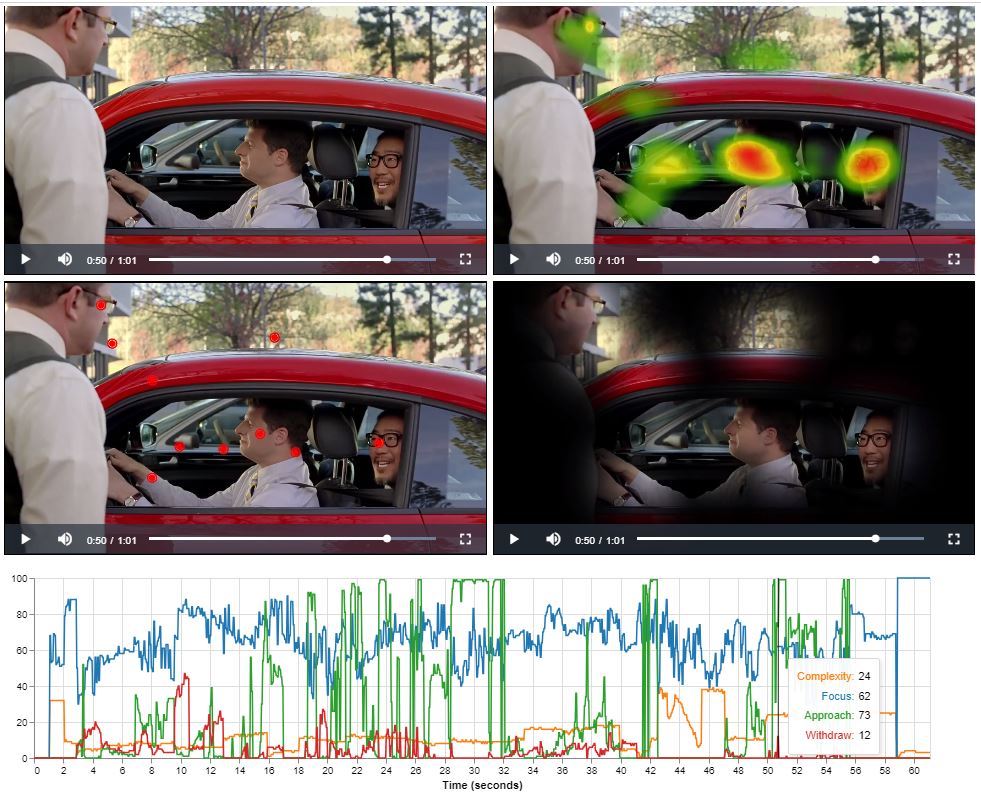 Analyzing a video frame by frame involves extracting Focus, Complexity, Approach and Withdraw scores to understand viewer attention and engagement.
This process segments the video, applies eye tracking algorithms to each frame, and extracts scores indicating where viewers focus, how they engage with complexity,
navigate through the content, and when they withdraw attention. These scores are then plotted on a timeline graph, with seconds along the x-axis and scores on the y-axis.
This visualization helps identify viewer behavior patterns and key moments, aiding in the optimization of video design and storytelling techniques for better viewer experience.
Analyzing a video frame by frame involves extracting Focus, Complexity, Approach and Withdraw scores to understand viewer attention and engagement.
This process segments the video, applies eye tracking algorithms to each frame, and extracts scores indicating where viewers focus, how they engage with complexity,
navigate through the content, and when they withdraw attention. These scores are then plotted on a timeline graph, with seconds along the x-axis and scores on the y-axis.
This visualization helps identify viewer behavior patterns and key moments, aiding in the optimization of video design and storytelling techniques for better viewer experience.